29
/
en
AIzaSyAYiBZKx7MnpbEhh9jyipgxe19OcubqV5w
April 1, 2024
226777
Puerto Rico
PRI
true
2
1
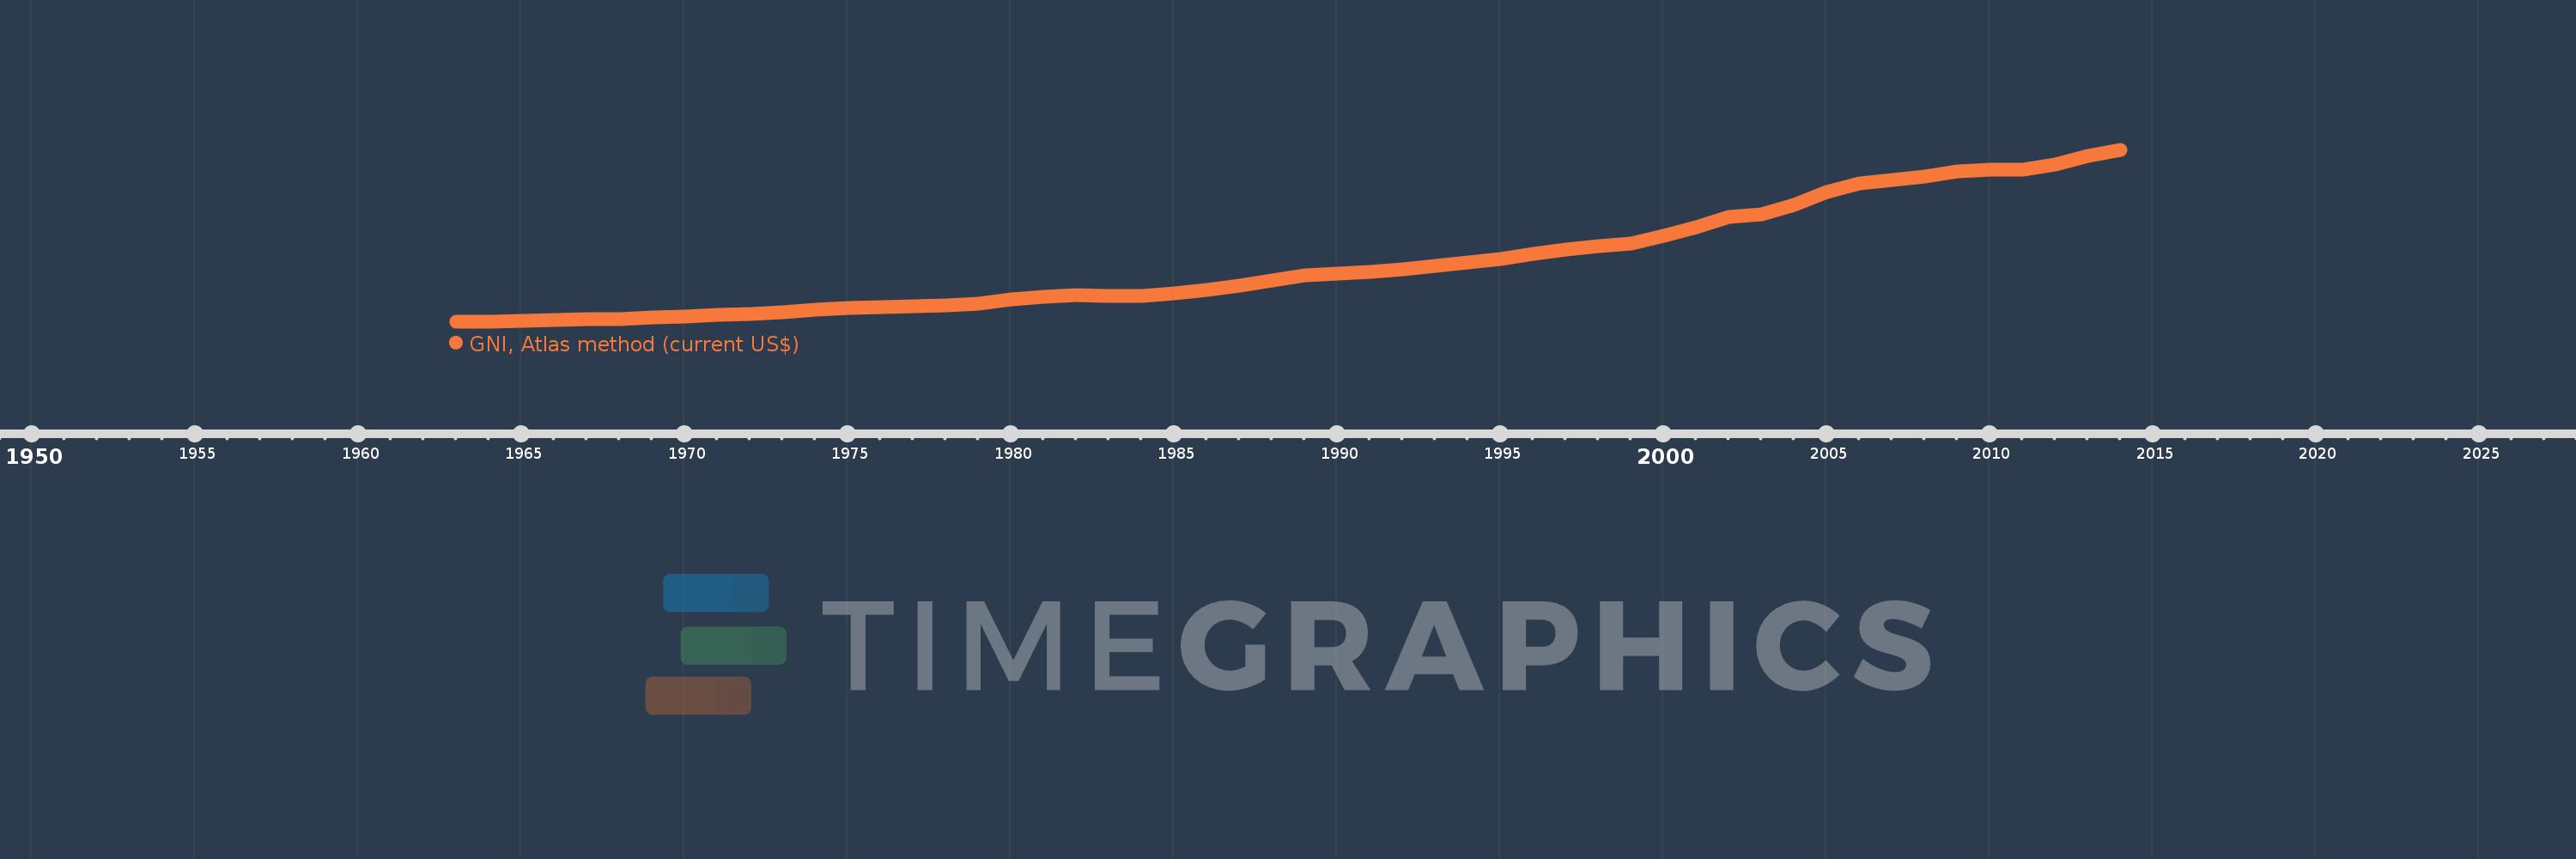
GNI, Atlas method (current US$)
2014,2013,2012,2011,2010,2009,2008,2007,2006,2005,2004,2003,2002,2001,2000,1999,1998,1997,1996,1995,1994,1993,1992,1991,1990,1989,1988,1987,1986,1985,1984,1983,1982,1981,1980,1979,1978,1977,1976,1975,1974,1973,1972,1971,1970,1969,1968,1967,1966,1965,1964,1963
This statistics in other country:
AfghanistanAlbaniaAlgeriaAndorraAngolaAntigua and BarbudaArab WorldArgentinaArmeniaAustraliaAustriaAzerbaijanBahamas, TheBahrainBangladeshBarbadosBelarusBelgiumBelizeBeninBermudaBhutanBoliviaBosnia and HerzegovinaBotswanaBrazilBrunei DarussalamBulgariaBurkina FasoBurundiCabo VerdeCambodiaCameroonCanadaCaribbean small statesCentral African RepublicCentral Europe and the BalticsChadChannel IslandsChileChinaColombiaComorosCongo, Dem. Rep.Congo, Rep.Costa RicaCote d'IvoireCroatiaCubaCyprusCzech RepublicDenmarkDjiboutiDominicaDominican RepublicEarly-demographic dividendEast Asia & PacificEast Asia & Pacific (excluding high income)East Asia & Pacific (IDA & IBRD countries)EcuadorEgypt, Arab Rep.El SalvadorEquatorial GuineaEritreaEstoniaEthiopiaEuro areaEurope & Central AsiaEurope & Central Asia (excluding high income)Europe & Central Asia (IDA & IBRD countries)European UnionFijiFinlandFragile and conflict affected situationsFranceFrench PolynesiaGabonGambia, TheGeorgiaGermanyGhanaGreeceGreenlandGrenadaGuatemalaGuineaGuinea-BissauGuyanaHaitiHeavily indebted poor countries (HIPC)High incomeHondurasHong Kong SAR, ChinaHungaryIBRD onlyIcelandIDA & IBRD totalIDA blendIDA onlyIDA totalIndiaIndonesiaIran, Islamic Rep.IraqIrelandIsle of ManIsraelItalyJamaicaJapanJordanKazakhstanKenyaKiribatiKorea, Rep.KosovoKuwaitKyrgyz RepublicLao PDRLate-demographic dividendLatin America & Caribbean Latin America & Caribbean (excluding high income)Latin America & the Caribbean (IDA & IBRD countries)LatviaLeast developed countries: UN classificationLebanonLesothoLiberiaLibyaLiechtensteinLithuaniaLow & middle incomeLow incomeLower middle incomeLuxembourgMacao SAR, ChinaMacedonia, FYRMadagascarMalawiMalaysiaMaldivesMaliMaltaMarshall IslandsMauritaniaMauritiusMexicoMicronesia, Fed. Sts.Middle East & North AfricaMiddle East & North Africa (excluding high income)Middle East & North Africa (IDA & IBRD countries)Middle incomeMoldovaMonacoMongoliaMontenegroMoroccoMozambiqueMyanmarNamibiaNauruNepalNetherlandsNew CaledoniaNew ZealandNicaraguaNigerNigeriaNorth AmericaNorwayOECD membersOmanOther small statesPacific island small statesPakistanPalauPanamaPapua New GuineaParaguayPeruPhilippinesPolandPortugalPost-demographic dividendPre-demographic dividendPuerto RicoQatarRomaniaRussian FederationRwandaSamoaSan MarinoSao Tome and PrincipeSaudi ArabiaSenegalSerbiaSeychellesSierra LeoneSingaporeSlovak RepublicSloveniaSmall statesSolomon IslandsSouth AfricaSouth AsiaSouth Asia (IDA & IBRD)South SudanSpainSri LankaSt. Kitts and NevisSt. LuciaSt. Vincent and the GrenadinesSub-Saharan Africa Sub-Saharan Africa (excluding high income)Sub-Saharan Africa (IDA & IBRD countries)SudanSurinameSwazilandSwedenSwitzerlandSyrian Arab RepublicTajikistanTanzaniaThailandTimor-LesteTogoTongaTrinidad and TobagoTunisiaTurkeyTurkmenistanTuvaluUgandaUkraineUnited Arab EmiratesUnited KingdomUnited StatesUpper middle incomeUruguayUzbekistanVanuatuVenezuela, RBVietnamVirgin Islands (U.S.)West Bank and GazaWorldYemen, Rep.ZambiaZimbabwe Timeline:
This timeline shows a graph from 1963 to 2014 of Puerto Rico. No data until 1962. Number of actual observations by date: 52.
Source name:
World Development Indicators
Source organization:
World Bank national accounts data, and OECD National Accounts data files.
Categories, topics:
Economy & Growth
Last updated:
apr 23, 2017
Indicators value changes by year
Minimum:
2.014 bln
jan 1, 1963
Maximum:
69.432 bln
jan 1, 2014
At the date of observation
Value
Absolute change
Change from previous value
jan 1, 1963
2.014 bln
+2.014 bln
0.0%
jan 1, 1964
2.243 bln
+228.303 mln
11.33%
jan 1, 1965
2.459 bln
+216.873 mln
9.67%
jan 1, 1966
2.754 bln
+294.609 mln
11.98%
jan 1, 1967
3.038 bln
+283.88 mln
10.31%
jan 1, 1968
3.28 bln
+242.502 mln
7.98%
jan 1, 1969
3.636 bln
+355.811 mln
10.85%
jan 1, 1970
4.192 bln
+555.841 mln
15.29%
jan 1, 1971
4.746 bln
+553.568 mln
13.2%
jan 1, 1972
5.281 bln
+535.402 mln
11.28%
jan 1, 1973
5.918 bln
+637.207 mln
12.07%
jan 1, 1974
6.854 bln
+936.062 mln
15.82%
jan 1, 1975
7.623 bln
+768.913 mln
11.22%
jan 1, 1976
7.965 bln
+341.71 mln
4.48%
jan 1, 1977
8.059 bln
+94.078 mln
1.18%
jan 1, 1978
8.466 bln
+407.419 mln
5.06%
jan 1, 1979
9.323 bln
+856.451 mln
10.12%
jan 1, 1980
10.754 bln
+1.431 bln
15.35%
jan 1, 1981
11.934 bln
+1.18 bln
10.97%
jan 1, 1982
12.6 bln
+665.762 mln
5.58%
jan 1, 1983
12.365 bln
-234.694 mln
-1.86%
jan 1, 1984
12.144 bln
-220.469 mln
-1.78%
jan 1, 1985
13.272 bln
+1.128 bln
9.29%
jan 1, 1986
14.453 bln
+1.18 bln
8.89%
jan 1, 1987
16.174 bln
+1.722 bln
11.91%
jan 1, 1988
18.315 bln
+2.141 bln
13.24%
jan 1, 1989
20.254 bln
+1.939 bln
10.59%
jan 1, 1990
20.965 bln
+711.167 mln
3.51%
jan 1, 1991
21.764 bln
+798.774 mln
3.81%
jan 1, 1992
22.655 bln
+891.416 mln
4.1%
jan 1, 1993
24.037 bln
+1.382 bln
6.1%
jan 1, 1994
25.485 bln
+1.448 bln
6.03%
jan 1, 1995
26.795 bln
+1.309 bln
5.14%
jan 1, 1996
28.715 bln
+1.92 bln
7.17%
jan 1, 1997
30.358 bln
+1.643 bln
5.72%
jan 1, 1998
31.68 bln
+1.322 bln
4.36%
jan 1, 1999
32.922 bln
+1.242 bln
3.92%
jan 1, 2000
35.812 bln
+2.89 bln
8.78%
jan 1, 2001
39.285 bln
+3.473 bln
9.7%
jan 1, 2002
43.336 bln
+4.051 bln
10.31%
jan 1, 2003
44.355 bln
+1.02 bln
2.35%
jan 1, 2004
47.947 bln
+3.591 bln
8.1%
jan 1, 2005
52.905 bln
+4.958 bln
10.34%
jan 1, 2006
56.348 bln
+3.443 bln
6.51%
jan 1, 2007
57.875 bln
+1.527 bln
2.71%
jan 1, 2008
59.226 bln
+1.351 bln
2.33%
jan 1, 2009
61.087 bln
+1.861 bln
3.14%
jan 1, 2010
61.861 bln
+773.704 mln
1.27%
jan 1, 2011
61.945 bln
+84.264 mln
0.14%
jan 1, 2012
63.838 bln
+1.894 bln
3.06%
jan 1, 2013
67.083 bln
+3.244 bln
5.08%
jan 1, 2014
69.432 bln
+2.35 bln
3.5%
Ranking of countries by current statistics by years


Comments: