29
/
en
AIzaSyAYiBZKx7MnpbEhh9jyipgxe19OcubqV5w
April 1, 2024
272270
Uganda
UGA
true
2
1
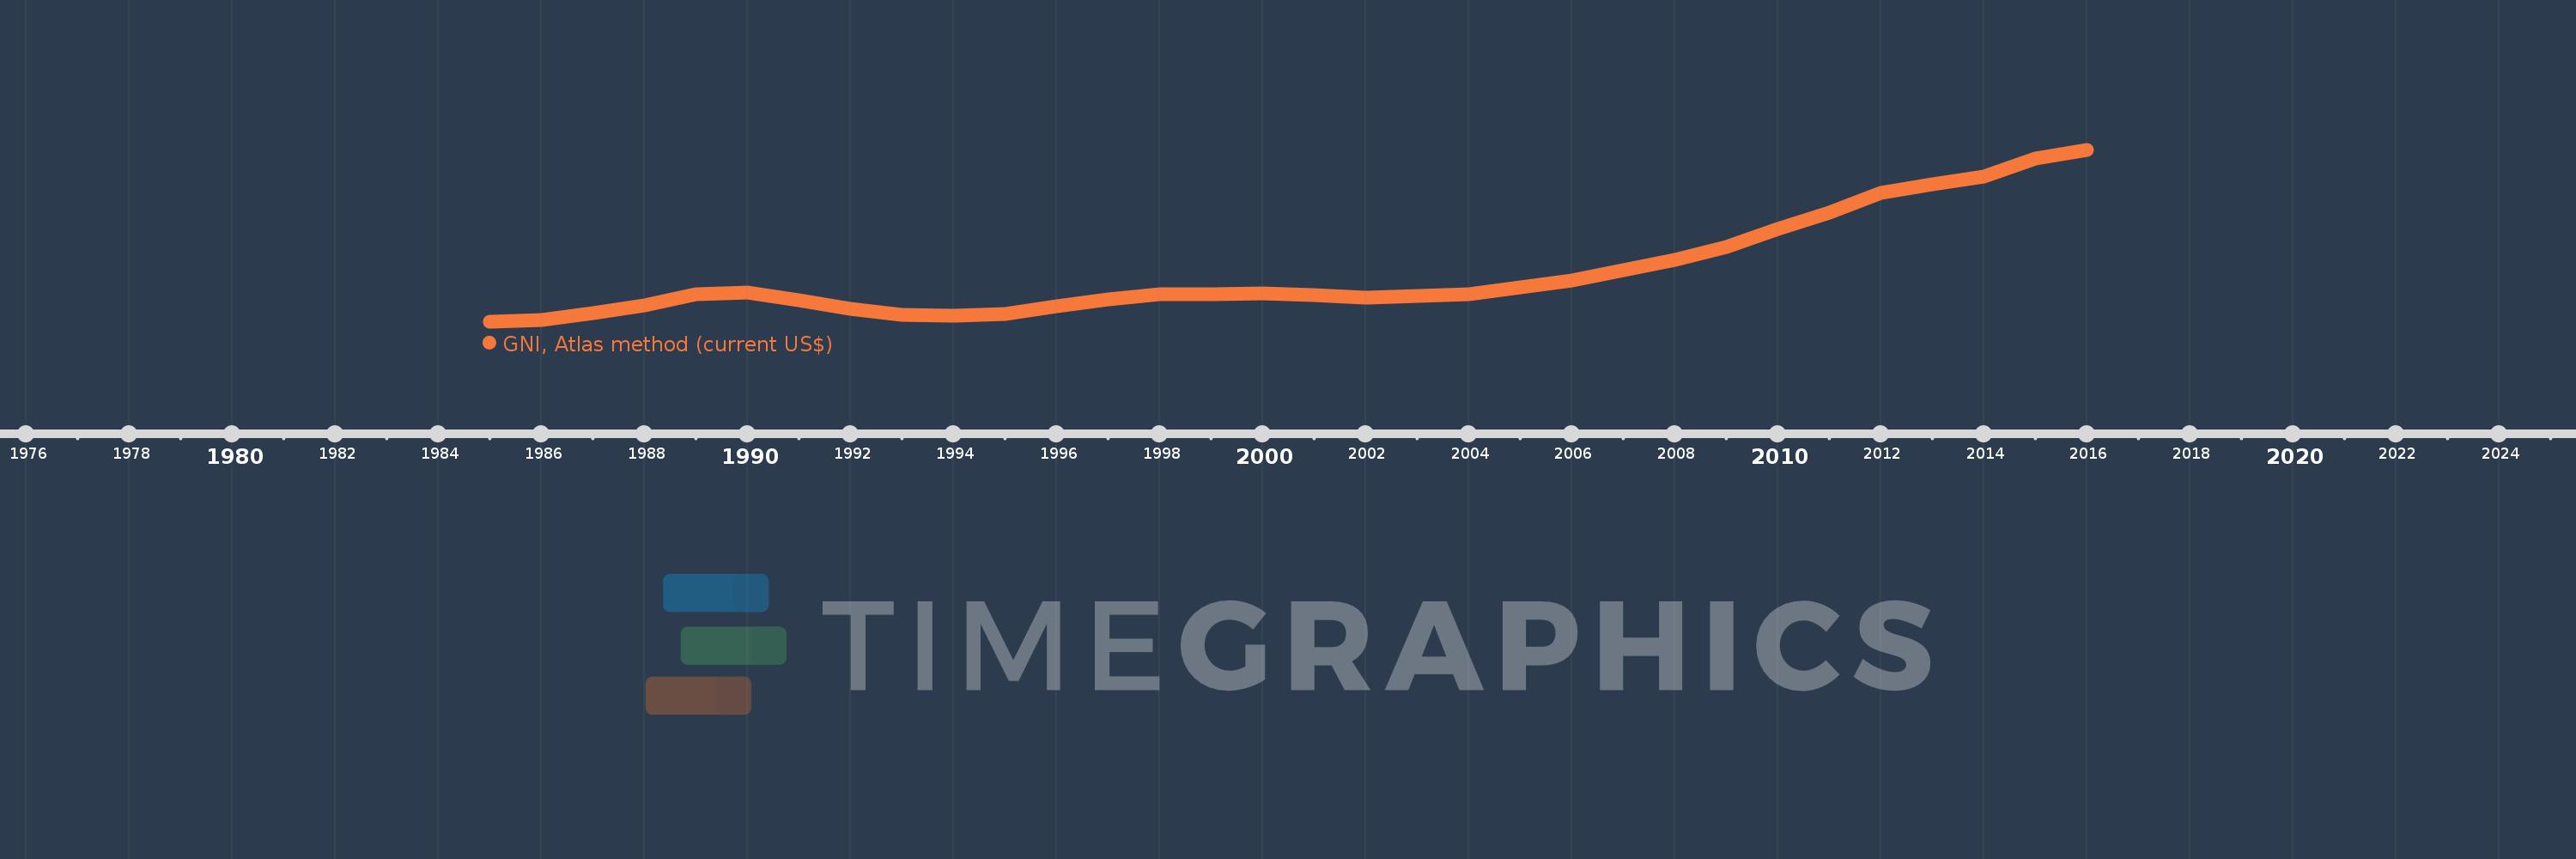
GNI, Atlas method (current US$)
2016,2015,2014,2013,2012,2011,2010,2009,2008,2007,2006,2005,2004,2003,2002,2001,2000,1999,1998,1997,1996,1995,1994,1993,1992,1991,1990,1989,1988,1987,1986,1985
This statistics in other country:
AfghanistanAlbaniaAlgeriaAndorraAngolaAntigua and BarbudaArab WorldArgentinaArmeniaAustraliaAustriaAzerbaijanBahamas, TheBahrainBangladeshBarbadosBelarusBelgiumBelizeBeninBermudaBhutanBoliviaBosnia and HerzegovinaBotswanaBrazilBrunei DarussalamBulgariaBurkina FasoBurundiCabo VerdeCambodiaCameroonCanadaCaribbean small statesCentral African RepublicCentral Europe and the BalticsChadChannel IslandsChileChinaColombiaComorosCongo, Dem. Rep.Congo, Rep.Costa RicaCote d'IvoireCroatiaCubaCyprusCzech RepublicDenmarkDjiboutiDominicaDominican RepublicEarly-demographic dividendEast Asia & PacificEast Asia & Pacific (excluding high income)East Asia & Pacific (IDA & IBRD countries)EcuadorEgypt, Arab Rep.El SalvadorEquatorial GuineaEritreaEstoniaEthiopiaEuro areaEurope & Central AsiaEurope & Central Asia (excluding high income)Europe & Central Asia (IDA & IBRD countries)European UnionFijiFinlandFragile and conflict affected situationsFranceFrench PolynesiaGabonGambia, TheGeorgiaGermanyGhanaGreeceGreenlandGrenadaGuatemalaGuineaGuinea-BissauGuyanaHaitiHeavily indebted poor countries (HIPC)High incomeHondurasHong Kong SAR, ChinaHungaryIBRD onlyIcelandIDA & IBRD totalIDA blendIDA onlyIDA totalIndiaIndonesiaIran, Islamic Rep.IraqIrelandIsle of ManIsraelItalyJamaicaJapanJordanKazakhstanKenyaKiribatiKorea, Rep.KosovoKuwaitKyrgyz RepublicLao PDRLate-demographic dividendLatin America & Caribbean Latin America & Caribbean (excluding high income)Latin America & the Caribbean (IDA & IBRD countries)LatviaLeast developed countries: UN classificationLebanonLesothoLiberiaLibyaLiechtensteinLithuaniaLow & middle incomeLow incomeLower middle incomeLuxembourgMacao SAR, ChinaMacedonia, FYRMadagascarMalawiMalaysiaMaldivesMaliMaltaMarshall IslandsMauritaniaMauritiusMexicoMicronesia, Fed. Sts.Middle East & North AfricaMiddle East & North Africa (excluding high income)Middle East & North Africa (IDA & IBRD countries)Middle incomeMoldovaMonacoMongoliaMontenegroMoroccoMozambiqueMyanmarNamibiaNauruNepalNetherlandsNew CaledoniaNew ZealandNicaraguaNigerNigeriaNorth AmericaNorwayOECD membersOmanOther small statesPacific island small statesPakistanPalauPanamaPapua New GuineaParaguayPeruPhilippinesPolandPortugalPost-demographic dividendPre-demographic dividendPuerto RicoQatarRomaniaRussian FederationRwandaSamoaSan MarinoSao Tome and PrincipeSaudi ArabiaSenegalSerbiaSeychellesSierra LeoneSingaporeSlovak RepublicSloveniaSmall statesSolomon IslandsSouth AfricaSouth AsiaSouth Asia (IDA & IBRD)South SudanSpainSri LankaSt. Kitts and NevisSt. LuciaSt. Vincent and the GrenadinesSub-Saharan Africa Sub-Saharan Africa (excluding high income)Sub-Saharan Africa (IDA & IBRD countries)SudanSurinameSwazilandSwedenSwitzerlandSyrian Arab RepublicTajikistanTanzaniaThailandTimor-LesteTogoTongaTrinidad and TobagoTunisiaTurkeyTurkmenistanTuvaluUgandaUkraineUnited Arab EmiratesUnited KingdomUnited StatesUpper middle incomeUruguayUzbekistanVanuatuVenezuela, RBVietnamVirgin Islands (U.S.)West Bank and GazaWorldYemen, Rep.ZambiaZimbabwe Timeline:
This timeline shows a graph from 1985 to 2016 of Uganda. No data until 1984. Number of actual observations by date: 32.
Source name:
World Development Indicators
Source organization:
World Bank national accounts data, and OECD National Accounts data files.
Categories, topics:
Economy & Growth
Last updated:
apr 23, 2017
Indicators value changes by year
Minimum:
2.505 bln
jan 1, 1985
Maximum:
27.257 bln
jan 1, 2016
At the date of observation
Value
Absolute change
Change from previous value
jan 1, 1985
2.505 bln
+2.505 bln
0.0%
jan 1, 1986
2.846 bln
+340.331 mln
13.58%
jan 1, 1987
3.754 bln
+908.554 mln
31.93%
jan 1, 1988
4.901 bln
+1.147 bln
30.54%
jan 1, 1989
6.446 bln
+1.545 bln
31.53%
jan 1, 1990
6.743 bln
+296.456 mln
4.6%
jan 1, 1991
5.638 bln
-1.105 bln
-16.38%
jan 1, 1992
4.415 bln
-1.223 bln
-21.69%
jan 1, 1993
3.55 bln
-864.658 mln
-19.58%
jan 1, 1994
3.403 bln
-147.103 mln
-4.14%
jan 1, 1995
3.629 bln
+225.521 mln
6.63%
jan 1, 1996
4.713 bln
+1.084 bln
29.87%
jan 1, 1997
5.81 bln
+1.097 bln
23.27%
jan 1, 1998
6.45 bln
+640.452 mln
11.02%
jan 1, 1999
6.469 bln
+19.485 mln
0.3%
jan 1, 2000
6.573 bln
+103.3 mln
1.6%
jan 1, 2001
6.398 bln
-174.321 mln
-2.65%
jan 1, 2002
6.051 bln
-347.772 mln
-5.44%
jan 1, 2003
6.303 bln
+252.055 mln
4.17%
jan 1, 2004
6.533 bln
+230.588 mln
3.66%
jan 1, 2005
7.448 bln
+915.025 mln
14.01%
jan 1, 2006
8.472 bln
+1.024 bln
13.75%
jan 1, 2007
9.952 bln
+1.479 bln
17.46%
jan 1, 2008
11.412 bln
+1.46 bln
14.67%
jan 1, 2009
13.276 bln
+1.864 bln
16.33%
jan 1, 2010
15.926 bln
+2.649 bln
19.96%
jan 1, 2011
18.239 bln
+2.314 bln
14.53%
jan 1, 2012
21.084 bln
+2.845 bln
15.6%
jan 1, 2013
22.359 bln
+1.275 bln
6.05%
jan 1, 2014
23.467 bln
+1.107 bln
4.95%
jan 1, 2015
26.008 bln
+2.542 bln
10.83%
jan 1, 2016
27.257 bln
+1.249 bln
4.8%
Ranking of countries by current statistics by years


Comments: