29
/
en
AIzaSyAYiBZKx7MnpbEhh9jyipgxe19OcubqV5w
April 1, 2024
67780
Angola
AGO
true
2
1
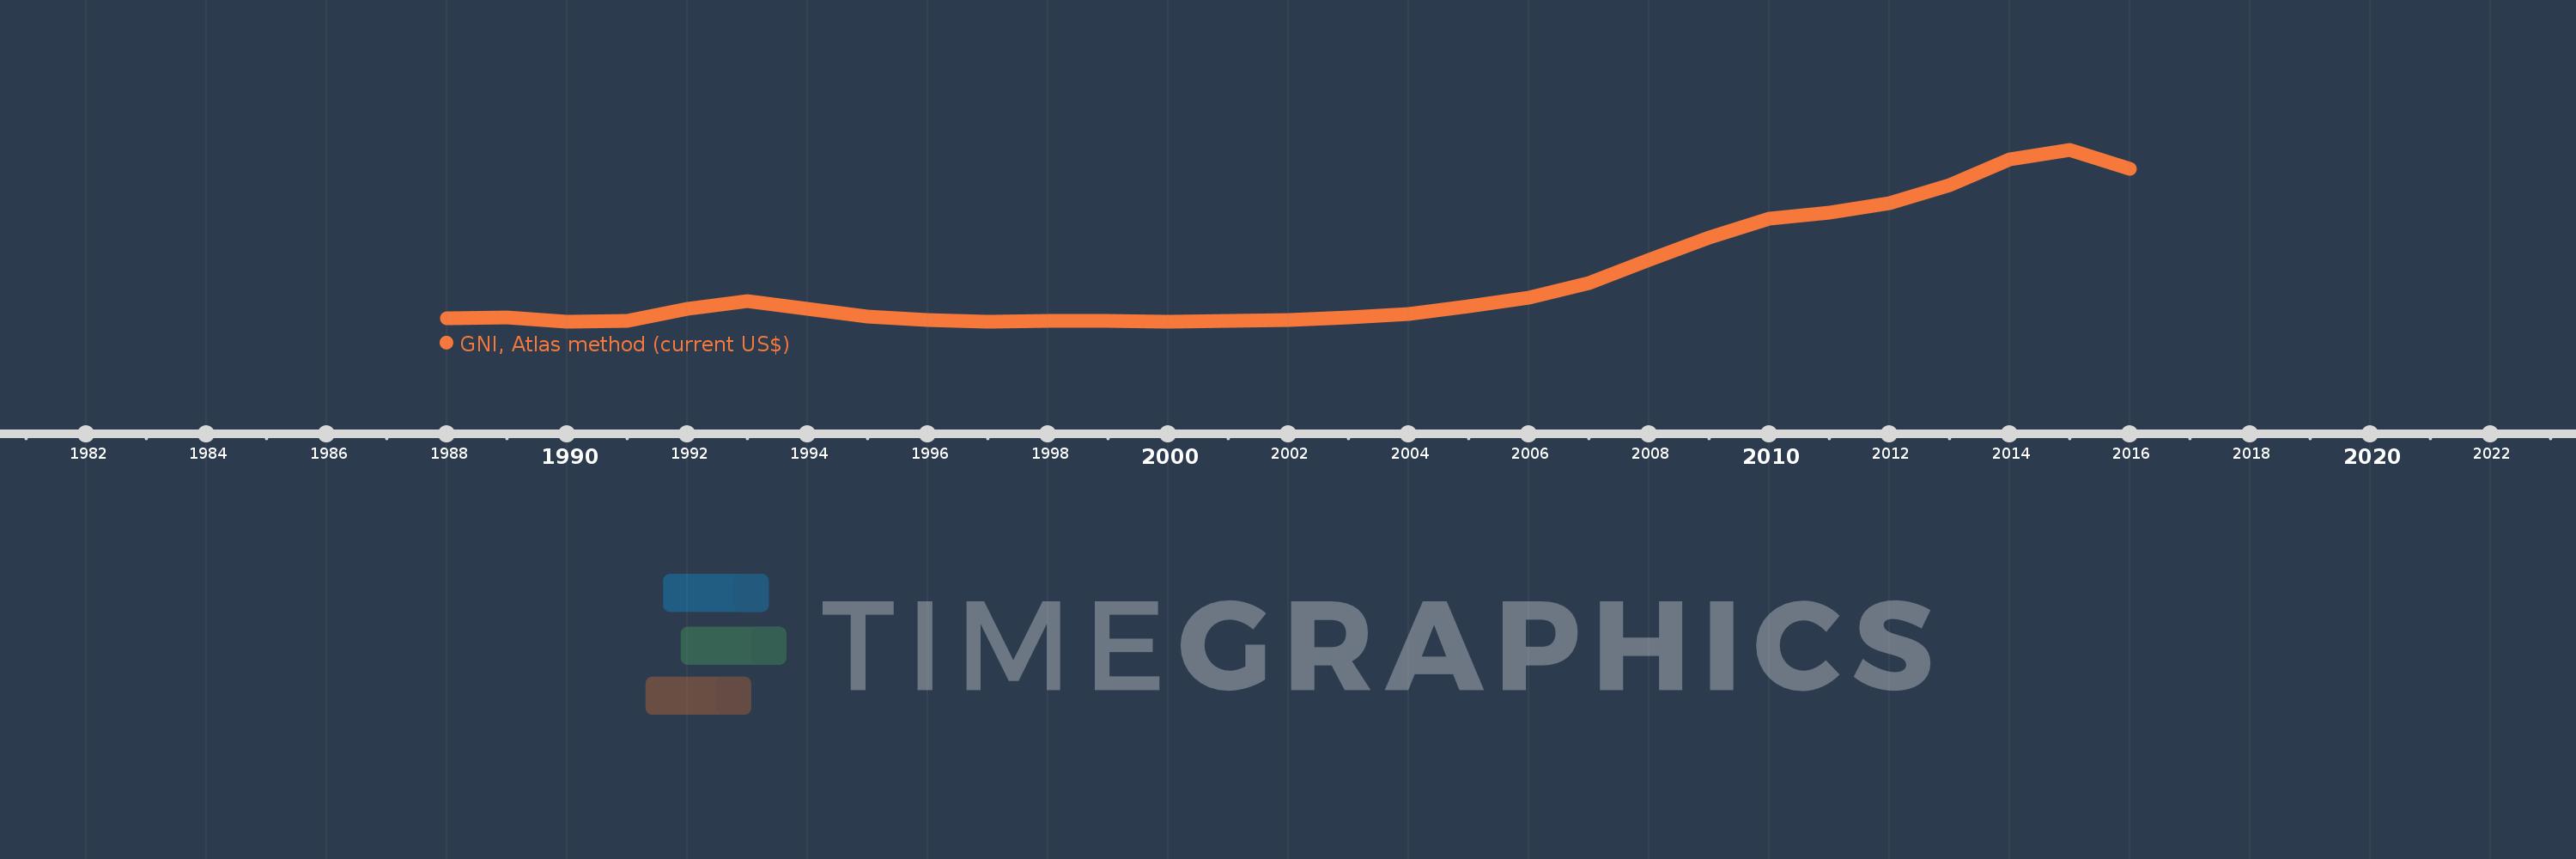
GNI, Atlas method (current US$)
2016,2015,2014,2013,2012,2011,2010,2009,2008,2007,2006,2005,2004,2003,2002,2001,2000,1999,1998,1997,1996,1995,1993,1992,1991,1990,1989,1988
This statistics in other country:
AfghanistanAlbaniaAlgeriaAndorraAngolaAntigua and BarbudaArab WorldArgentinaArmeniaAustraliaAustriaAzerbaijanBahamas, TheBahrainBangladeshBarbadosBelarusBelgiumBelizeBeninBermudaBhutanBoliviaBosnia and HerzegovinaBotswanaBrazilBrunei DarussalamBulgariaBurkina FasoBurundiCabo VerdeCambodiaCameroonCanadaCaribbean small statesCentral African RepublicCentral Europe and the BalticsChadChannel IslandsChileChinaColombiaComorosCongo, Dem. Rep.Congo, Rep.Costa RicaCote d'IvoireCroatiaCubaCyprusCzech RepublicDenmarkDjiboutiDominicaDominican RepublicEarly-demographic dividendEast Asia & PacificEast Asia & Pacific (excluding high income)East Asia & Pacific (IDA & IBRD countries)EcuadorEgypt, Arab Rep.El SalvadorEquatorial GuineaEritreaEstoniaEthiopiaEuro areaEurope & Central AsiaEurope & Central Asia (excluding high income)Europe & Central Asia (IDA & IBRD countries)European UnionFijiFinlandFragile and conflict affected situationsFranceFrench PolynesiaGabonGambia, TheGeorgiaGermanyGhanaGreeceGreenlandGrenadaGuatemalaGuineaGuinea-BissauGuyanaHaitiHeavily indebted poor countries (HIPC)High incomeHondurasHong Kong SAR, ChinaHungaryIBRD onlyIcelandIDA & IBRD totalIDA blendIDA onlyIDA totalIndiaIndonesiaIran, Islamic Rep.IraqIrelandIsle of ManIsraelItalyJamaicaJapanJordanKazakhstanKenyaKiribatiKorea, Rep.KosovoKuwaitKyrgyz RepublicLao PDRLate-demographic dividendLatin America & Caribbean Latin America & Caribbean (excluding high income)Latin America & the Caribbean (IDA & IBRD countries)LatviaLeast developed countries: UN classificationLebanonLesothoLiberiaLibyaLiechtensteinLithuaniaLow & middle incomeLow incomeLower middle incomeLuxembourgMacao SAR, ChinaMacedonia, FYRMadagascarMalawiMalaysiaMaldivesMaliMaltaMarshall IslandsMauritaniaMauritiusMexicoMicronesia, Fed. Sts.Middle East & North AfricaMiddle East & North Africa (excluding high income)Middle East & North Africa (IDA & IBRD countries)Middle incomeMoldovaMonacoMongoliaMontenegroMoroccoMozambiqueMyanmarNamibiaNauruNepalNetherlandsNew CaledoniaNew ZealandNicaraguaNigerNigeriaNorth AmericaNorwayOECD membersOmanOther small statesPacific island small statesPakistanPalauPanamaPapua New GuineaParaguayPeruPhilippinesPolandPortugalPost-demographic dividendPre-demographic dividendPuerto RicoQatarRomaniaRussian FederationRwandaSamoaSan MarinoSao Tome and PrincipeSaudi ArabiaSenegalSerbiaSeychellesSierra LeoneSingaporeSlovak RepublicSloveniaSmall statesSolomon IslandsSouth AfricaSouth AsiaSouth Asia (IDA & IBRD)South SudanSpainSri LankaSt. Kitts and NevisSt. LuciaSt. Vincent and the GrenadinesSub-Saharan Africa Sub-Saharan Africa (excluding high income)Sub-Saharan Africa (IDA & IBRD countries)SudanSurinameSwazilandSwedenSwitzerlandSyrian Arab RepublicTajikistanTanzaniaThailandTimor-LesteTogoTongaTrinidad and TobagoTunisiaTurkeyTurkmenistanTuvaluUgandaUkraineUnited Arab EmiratesUnited KingdomUnited StatesUpper middle incomeUruguayUzbekistanVanuatuVenezuela, RBVietnamVirgin Islands (U.S.)West Bank and GazaWorldYemen, Rep.ZambiaZimbabwe Timeline:
This timeline shows a graph from 1988 to 2016 of Angola. No data until 1987. Number of actual observations by date: 28.
Source name:
World Development Indicators
Source organization:
World Bank national accounts data, and OECD National Accounts data files.
Categories, topics:
Economy & Growth
Last updated:
apr 23, 2017
Indicators value changes by year
Minimum:
5.251 bln
jan 1, 2000
Maximum:
116.318 bln
jan 1, 2015
At the date of observation
Value
Absolute change
Change from previous value
jan 1, 1988
7.759 bln
+7.759 bln
0.0%
jan 1, 1989
7.952 bln
+193.647 mln
2.5%
jan 1, 1990
5.622 bln
-2.331 bln
-29.31%
jan 1, 1991
6.099 bln
+476.859 mln
8.48%
jan 1, 1992
13.824 bln
+7.726 bln
126.68%
jan 1, 1993
18.697 bln
+4.873 bln
35.25%
jan 1, 1995
8.907 bln
-9.79 bln
-52.36%
jan 1, 1996
6.367 bln
-2.54 bln
-28.52%
jan 1, 1997
5.394 bln
-972.557 mln
-15.28%
jan 1, 1998
5.974 bln
+579.651 mln
10.75%
jan 1, 1999
6.086 bln
+111.89 mln
1.87%
jan 1, 2000
5.251 bln
-834.845 mln
-13.72%
jan 1, 2001
5.903 bln
+652.094 mln
12.42%
jan 1, 2002
6.69 bln
+786.577 mln
13.32%
jan 1, 2003
8.219 bln
+1.53 bln
22.87%
jan 1, 2004
10.296 bln
+2.077 bln
25.27%
jan 1, 2005
15.242 bln
+4.946 bln
48.04%
jan 1, 2006
20.934 bln
+5.692 bln
37.35%
jan 1, 2007
30.254 bln
+9.319 bln
44.52%
jan 1, 2008
45.315 bln
+15.061 bln
49.78%
jan 1, 2009
59.978 bln
+14.663 bln
32.36%
jan 1, 2010
71.97 bln
+11.992 bln
19.99%
jan 1, 2011
75.707 bln
+3.737 bln
5.19%
jan 1, 2012
82.097 bln
+6.39 bln
8.44%
jan 1, 2013
93.811 bln
+11.714 bln
14.27%
jan 1, 2014
110.65 bln
+16.839 bln
17.95%
jan 1, 2015
116.318 bln
+5.668 bln
5.12%
jan 1, 2016
104.506 bln
-11.813 bln
-10.16%
Ranking of countries by current statistics by years


Comments: