29
/
en
AIzaSyAYiBZKx7MnpbEhh9jyipgxe19OcubqV5w
April 1, 2024
94893
Burkina Faso
BFA
true
2
1
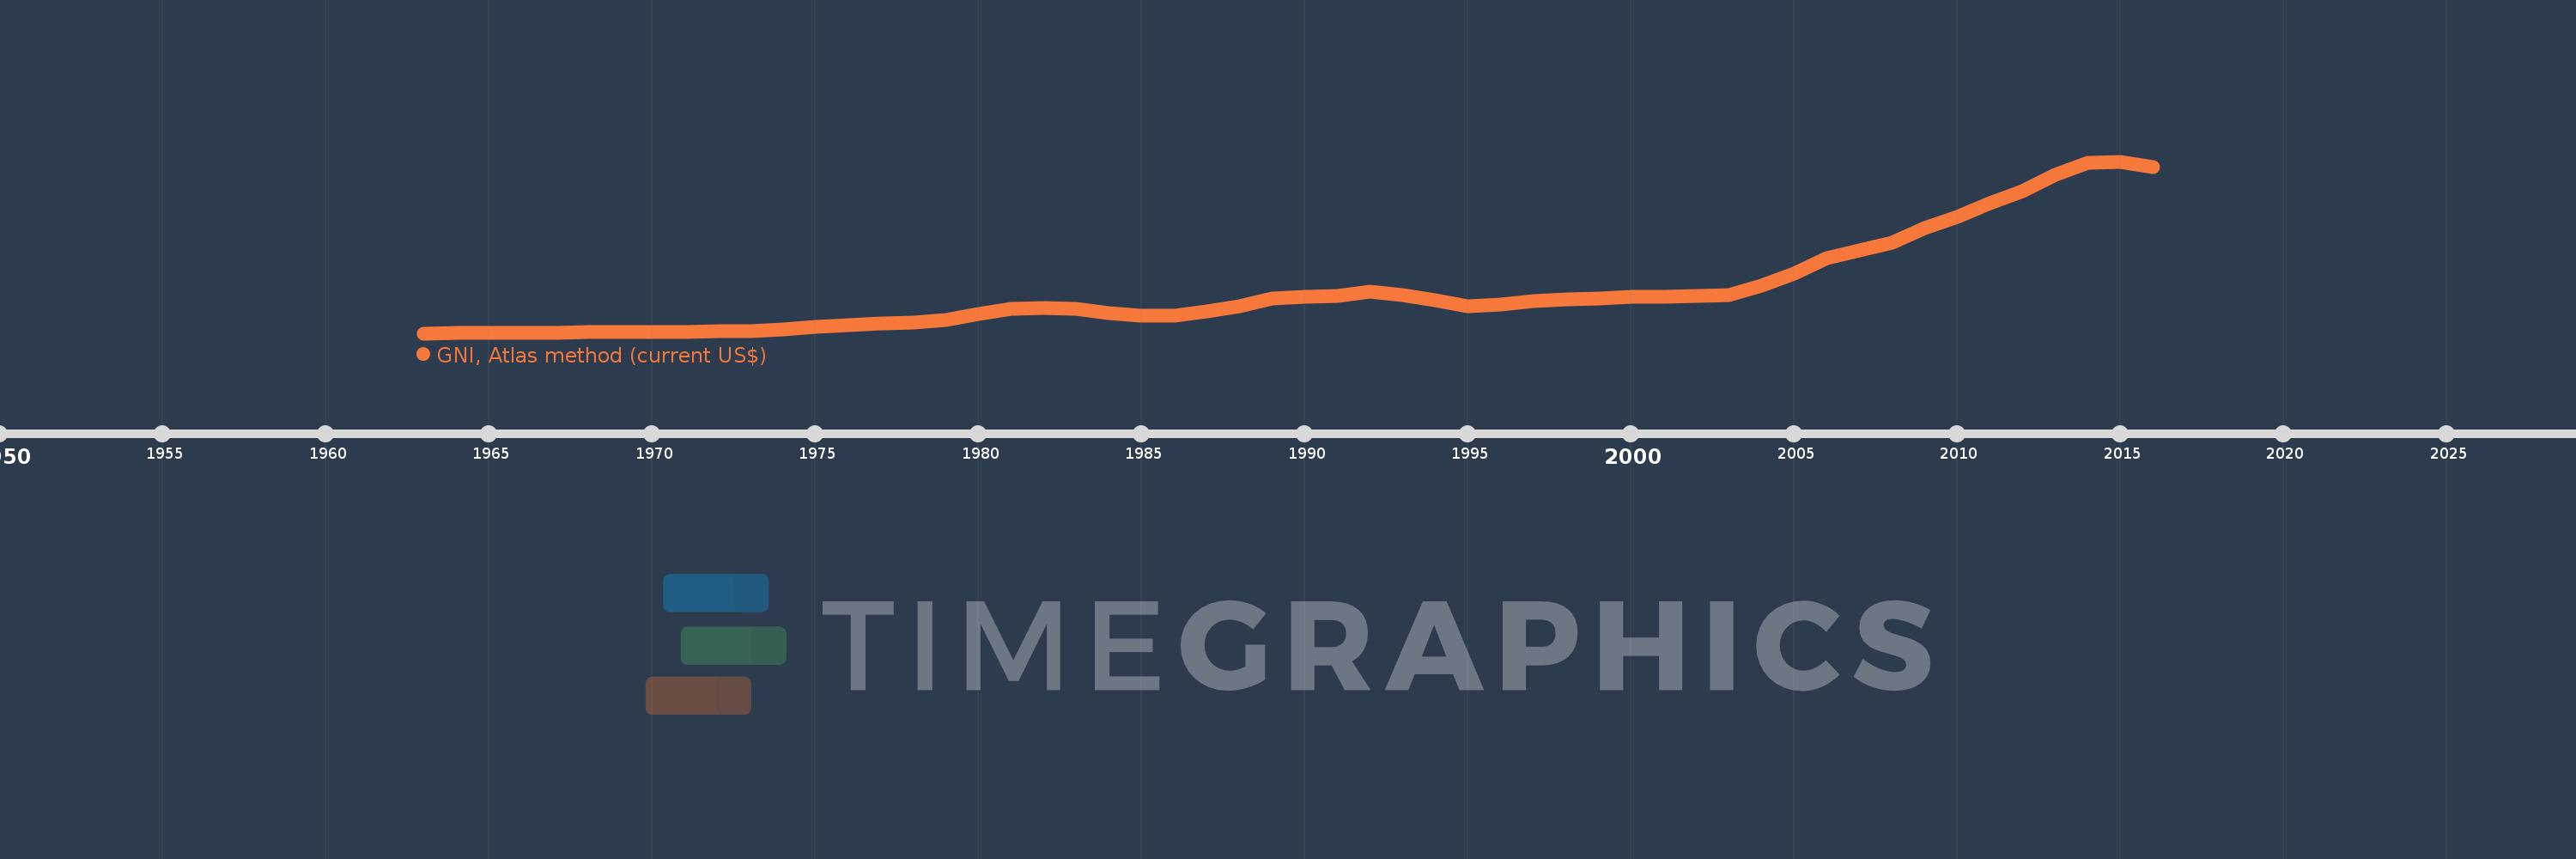
GNI, Atlas method (current US$)
2016,2015,2014,2013,2012,2011,2010,2009,2008,2007,2006,2005,2004,2003,2002,2001,2000,1999,1998,1997,1996,1995,1994,1993,1992,1991,1990,1989,1988,1987,1986,1985,1984,1983,1982,1981,1980,1979,1978,1977,1976,1975,1974,1973,1972,1971,1970,1969,1968,1967,1966,1965,1964,1963
This statistics in other country:
AfghanistanAlbaniaAlgeriaAndorraAngolaAntigua and BarbudaArab WorldArgentinaArmeniaAustraliaAustriaAzerbaijanBahamas, TheBahrainBangladeshBarbadosBelarusBelgiumBelizeBeninBermudaBhutanBoliviaBosnia and HerzegovinaBotswanaBrazilBrunei DarussalamBulgariaBurkina FasoBurundiCabo VerdeCambodiaCameroonCanadaCaribbean small statesCentral African RepublicCentral Europe and the BalticsChadChannel IslandsChileChinaColombiaComorosCongo, Dem. Rep.Congo, Rep.Costa RicaCote d'IvoireCroatiaCubaCyprusCzech RepublicDenmarkDjiboutiDominicaDominican RepublicEarly-demographic dividendEast Asia & PacificEast Asia & Pacific (excluding high income)East Asia & Pacific (IDA & IBRD countries)EcuadorEgypt, Arab Rep.El SalvadorEquatorial GuineaEritreaEstoniaEthiopiaEuro areaEurope & Central AsiaEurope & Central Asia (excluding high income)Europe & Central Asia (IDA & IBRD countries)European UnionFijiFinlandFragile and conflict affected situationsFranceFrench PolynesiaGabonGambia, TheGeorgiaGermanyGhanaGreeceGreenlandGrenadaGuatemalaGuineaGuinea-BissauGuyanaHaitiHeavily indebted poor countries (HIPC)High incomeHondurasHong Kong SAR, ChinaHungaryIBRD onlyIcelandIDA & IBRD totalIDA blendIDA onlyIDA totalIndiaIndonesiaIran, Islamic Rep.IraqIrelandIsle of ManIsraelItalyJamaicaJapanJordanKazakhstanKenyaKiribatiKorea, Rep.KosovoKuwaitKyrgyz RepublicLao PDRLate-demographic dividendLatin America & Caribbean Latin America & Caribbean (excluding high income)Latin America & the Caribbean (IDA & IBRD countries)LatviaLeast developed countries: UN classificationLebanonLesothoLiberiaLibyaLiechtensteinLithuaniaLow & middle incomeLow incomeLower middle incomeLuxembourgMacao SAR, ChinaMacedonia, FYRMadagascarMalawiMalaysiaMaldivesMaliMaltaMarshall IslandsMauritaniaMauritiusMexicoMicronesia, Fed. Sts.Middle East & North AfricaMiddle East & North Africa (excluding high income)Middle East & North Africa (IDA & IBRD countries)Middle incomeMoldovaMonacoMongoliaMontenegroMoroccoMozambiqueMyanmarNamibiaNauruNepalNetherlandsNew CaledoniaNew ZealandNicaraguaNigerNigeriaNorth AmericaNorwayOECD membersOmanOther small statesPacific island small statesPakistanPalauPanamaPapua New GuineaParaguayPeruPhilippinesPolandPortugalPost-demographic dividendPre-demographic dividendPuerto RicoQatarRomaniaRussian FederationRwandaSamoaSan MarinoSao Tome and PrincipeSaudi ArabiaSenegalSerbiaSeychellesSierra LeoneSingaporeSlovak RepublicSloveniaSmall statesSolomon IslandsSouth AfricaSouth AsiaSouth Asia (IDA & IBRD)South SudanSpainSri LankaSt. Kitts and NevisSt. LuciaSt. Vincent and the GrenadinesSub-Saharan Africa Sub-Saharan Africa (excluding high income)Sub-Saharan Africa (IDA & IBRD countries)SudanSurinameSwazilandSwedenSwitzerlandSyrian Arab RepublicTajikistanTanzaniaThailandTimor-LesteTogoTongaTrinidad and TobagoTunisiaTurkeyTurkmenistanTuvaluUgandaUkraineUnited Arab EmiratesUnited KingdomUnited StatesUpper middle incomeUruguayUzbekistanVanuatuVenezuela, RBVietnamVirgin Islands (U.S.)West Bank and GazaWorldYemen, Rep.ZambiaZimbabwe Timeline:
This timeline shows a graph from 1963 to 2016 of Burkina Faso. No data until 1962. Number of actual observations by date: 54.
Source name:
World Development Indicators
Source organization:
World Bank national accounts data, and OECD National Accounts data files.
Categories, topics:
Economy & Growth
Last updated:
apr 23, 2017
Indicators value changes by year
Minimum:
387.079 mln
jan 1, 1963
Maximum:
11.987 bln
jan 1, 2015
At the date of observation
Value
Absolute change
Change from previous value
jan 1, 1963
387.079 mln
+387.079 mln
0.0%
jan 1, 1964
387.901 mln
+821.572K
0.21%
jan 1, 1965
408.452 mln
+20.551 mln
5.3%
jan 1, 1966
428.516 mln
+20.064 mln
4.91%
jan 1, 1967
440.441 mln
+11.926 mln
2.78%
jan 1, 1968
474.419 mln
+33.977 mln
7.71%
jan 1, 1969
488.391 mln
+13.972 mln
2.95%
jan 1, 1970
495.558 mln
+7.167 mln
1.47%
jan 1, 1971
492.796 mln
-2.761 mln
-0.56%
jan 1, 1972
503.421 mln
+10.625 mln
2.16%
jan 1, 1973
551.66 mln
+48.238 mln
9.58%
jan 1, 1974
657.214 mln
+105.555 mln
19.13%
jan 1, 1975
829.368 mln
+172.154 mln
26.19%
jan 1, 1976
962.066 mln
+132.698 mln
16.0%
jan 1, 1977
1.041 bln
+78.515 mln
8.16%
jan 1, 1978
1.1 bln
+59.708 mln
5.74%
jan 1, 1979
1.307 bln
+206.959 mln
18.81%
jan 1, 1980
1.673 bln
+365.639 mln
27.97%
jan 1, 1981
2.016 bln
+343.296 mln
20.52%
jan 1, 1982
2.08 bln
+63.616 mln
3.16%
jan 1, 1983
2.021 bln
-59.165 mln
-2.84%
jan 1, 1984
1.726 bln
-294.205 mln
-14.56%
jan 1, 1985
1.55 bln
-176.094 mln
-10.2%
jan 1, 1986
1.6 bln
+49.682 mln
3.2%
jan 1, 1987
1.865 bln
+264.865 mln
16.55%
jan 1, 1988
2.19 bln
+324.989 mln
17.43%
jan 1, 1989
2.716 bln
+526.071 mln
24.02%
jan 1, 1990
2.829 bln
+112.871 mln
4.16%
jan 1, 1991
2.923 bln
+93.95 mln
3.32%
jan 1, 1992
3.227 bln
+304.437 mln
10.42%
jan 1, 1993
2.942 bln
-285.425 mln
-8.84%
jan 1, 1994
2.647 bln
-294.423 mln
-10.01%
jan 1, 1995
2.236 bln
-410.895 mln
-15.52%
jan 1, 1996
2.357 bln
+120.889 mln
5.41%
jan 1, 1997
2.562 bln
+204.675 mln
8.68%
jan 1, 1998
2.682 bln
+120.117 mln
4.69%
jan 1, 1999
2.73 bln
+47.442 mln
1.77%
jan 1, 2000
2.868 bln
+138.761 mln
5.08%
jan 1, 2001
2.869 bln
+620.825K
0.02%
jan 1, 2002
2.903 bln
+33.707 mln
1.17%
jan 1, 2003
2.964 bln
+61.04 mln
2.1%
jan 1, 2004
3.579 bln
+614.907 mln
20.75%
jan 1, 2005
4.425 bln
+846.476 mln
23.65%
jan 1, 2006
5.437 bln
+1.012 bln
22.87%
jan 1, 2007
6.005 bln
+567.411 mln
10.44%
jan 1, 2008
6.486 bln
+481.461 mln
8.02%
jan 1, 2009
7.512 bln
+1.026 bln
15.82%
jan 1, 2010
8.238 bln
+725.494 mln
9.66%
jan 1, 2011
9.146 bln
+907.76 mln
11.02%
jan 1, 2012
10.0 bln
+854.204 mln
9.34%
jan 1, 2013
11.065 bln
+1.065 bln
10.65%
jan 1, 2014
11.876 bln
+810.733 mln
7.33%
jan 1, 2015
11.987 bln
+110.968 mln
0.93%
jan 1, 2016
11.582 bln
-405.261 mln
-3.38%
Ranking of countries by current statistics by years


Comments: