29
/
en
AIzaSyAYiBZKx7MnpbEhh9jyipgxe19OcubqV5w
April 1, 2024
248742
Sri Lanka
LKA
true
2
1
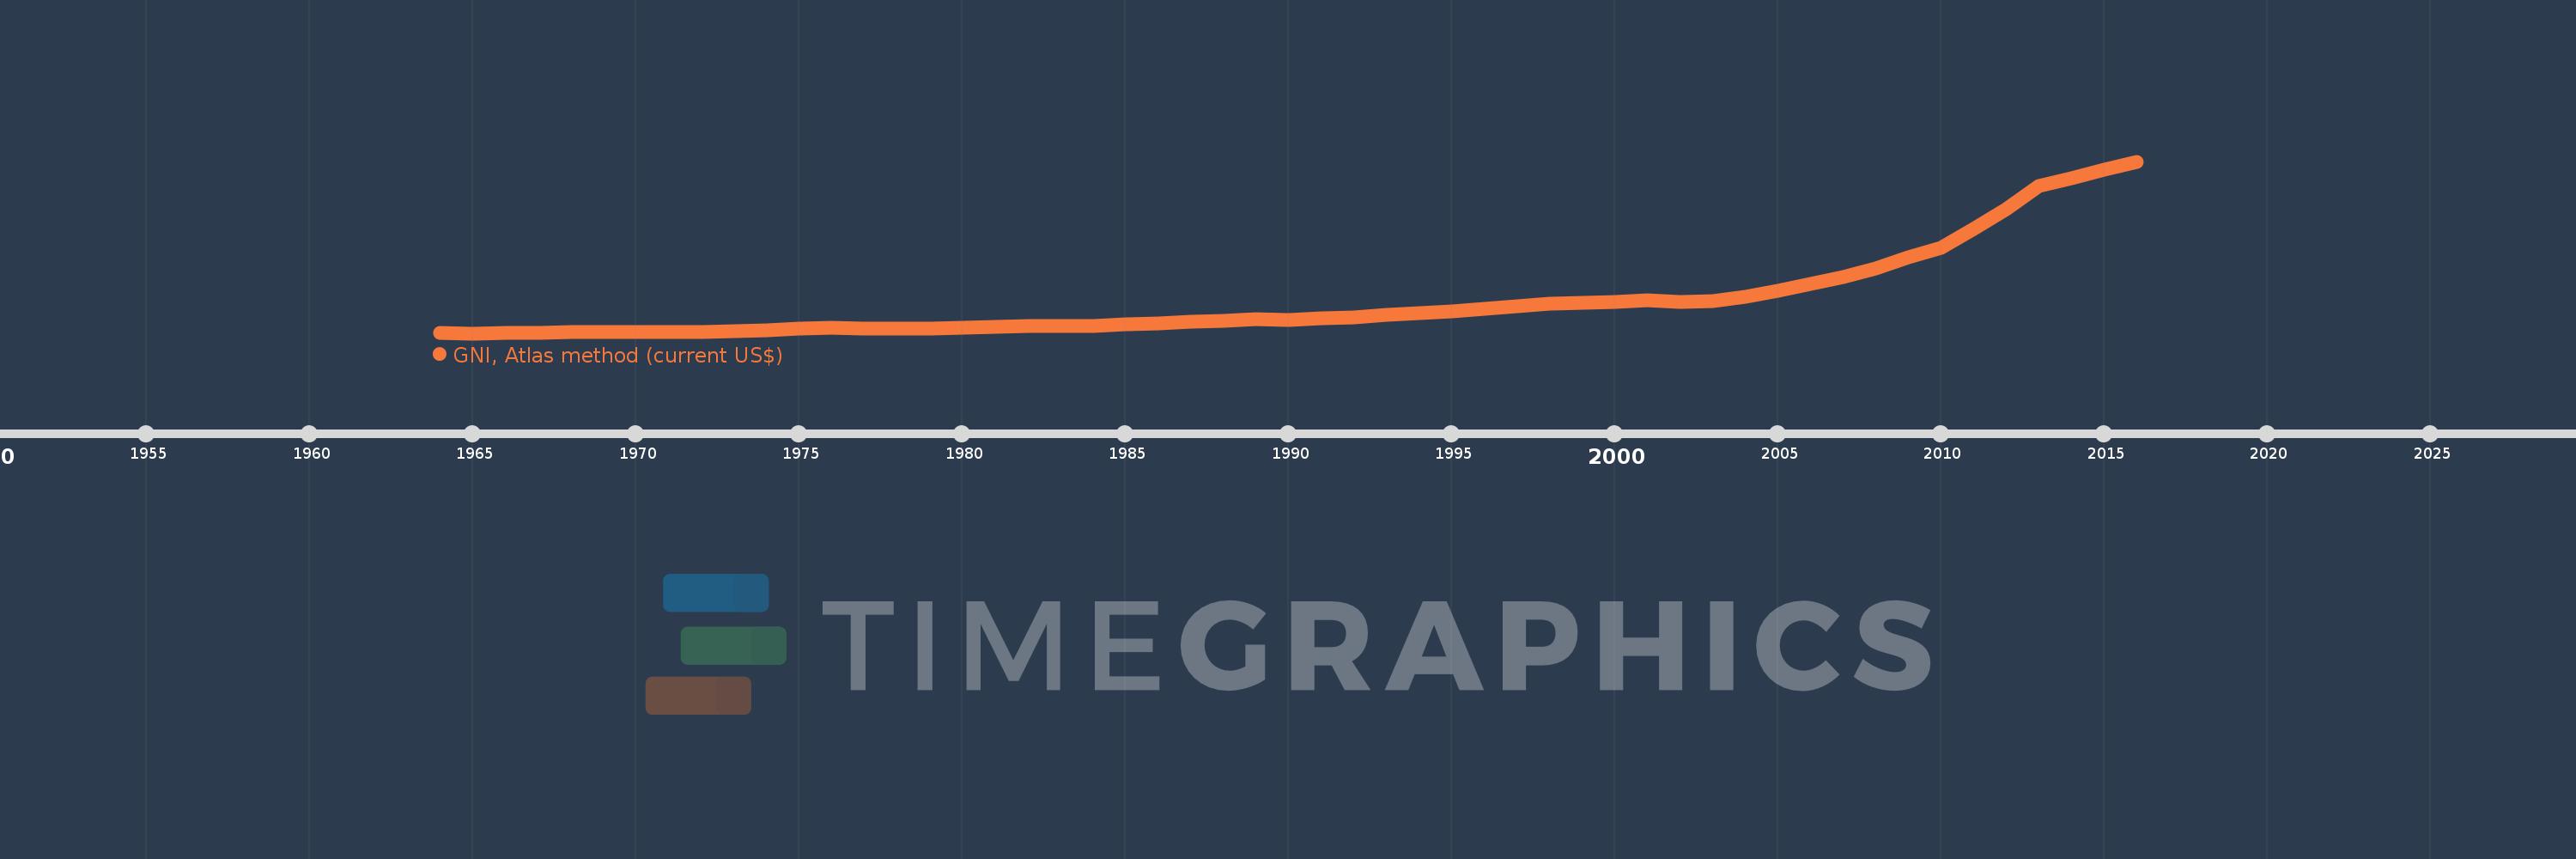
GNI, Atlas method (current US$)
2016,2015,2014,2013,2012,2011,2010,2009,2008,2007,2006,2005,2004,2003,2002,2001,2000,1999,1998,1997,1996,1995,1994,1993,1992,1991,1990,1989,1988,1987,1986,1985,1984,1983,1982,1981,1980,1979,1978,1977,1976,1975,1974,1973,1972,1971,1970,1969,1968,1967,1966,1965,1964
This statistics in other country:
AfghanistanAlbaniaAlgeriaAndorraAngolaAntigua and BarbudaArab WorldArgentinaArmeniaAustraliaAustriaAzerbaijanBahamas, TheBahrainBangladeshBarbadosBelarusBelgiumBelizeBeninBermudaBhutanBoliviaBosnia and HerzegovinaBotswanaBrazilBrunei DarussalamBulgariaBurkina FasoBurundiCabo VerdeCambodiaCameroonCanadaCaribbean small statesCentral African RepublicCentral Europe and the BalticsChadChannel IslandsChileChinaColombiaComorosCongo, Dem. Rep.Congo, Rep.Costa RicaCote d'IvoireCroatiaCubaCyprusCzech RepublicDenmarkDjiboutiDominicaDominican RepublicEarly-demographic dividendEast Asia & PacificEast Asia & Pacific (excluding high income)East Asia & Pacific (IDA & IBRD countries)EcuadorEgypt, Arab Rep.El SalvadorEquatorial GuineaEritreaEstoniaEthiopiaEuro areaEurope & Central AsiaEurope & Central Asia (excluding high income)Europe & Central Asia (IDA & IBRD countries)European UnionFijiFinlandFragile and conflict affected situationsFranceFrench PolynesiaGabonGambia, TheGeorgiaGermanyGhanaGreeceGreenlandGrenadaGuatemalaGuineaGuinea-BissauGuyanaHaitiHeavily indebted poor countries (HIPC)High incomeHondurasHong Kong SAR, ChinaHungaryIBRD onlyIcelandIDA & IBRD totalIDA blendIDA onlyIDA totalIndiaIndonesiaIran, Islamic Rep.IraqIrelandIsle of ManIsraelItalyJamaicaJapanJordanKazakhstanKenyaKiribatiKorea, Rep.KosovoKuwaitKyrgyz RepublicLao PDRLate-demographic dividendLatin America & Caribbean Latin America & Caribbean (excluding high income)Latin America & the Caribbean (IDA & IBRD countries)LatviaLeast developed countries: UN classificationLebanonLesothoLiberiaLibyaLiechtensteinLithuaniaLow & middle incomeLow incomeLower middle incomeLuxembourgMacao SAR, ChinaMacedonia, FYRMadagascarMalawiMalaysiaMaldivesMaliMaltaMarshall IslandsMauritaniaMauritiusMexicoMicronesia, Fed. Sts.Middle East & North AfricaMiddle East & North Africa (excluding high income)Middle East & North Africa (IDA & IBRD countries)Middle incomeMoldovaMonacoMongoliaMontenegroMoroccoMozambiqueMyanmarNamibiaNauruNepalNetherlandsNew CaledoniaNew ZealandNicaraguaNigerNigeriaNorth AmericaNorwayOECD membersOmanOther small statesPacific island small statesPakistanPalauPanamaPapua New GuineaParaguayPeruPhilippinesPolandPortugalPost-demographic dividendPre-demographic dividendPuerto RicoQatarRomaniaRussian FederationRwandaSamoaSan MarinoSao Tome and PrincipeSaudi ArabiaSenegalSerbiaSeychellesSierra LeoneSingaporeSlovak RepublicSloveniaSmall statesSolomon IslandsSouth AfricaSouth AsiaSouth Asia (IDA & IBRD)South SudanSpainSri LankaSt. Kitts and NevisSt. LuciaSt. Vincent and the GrenadinesSub-Saharan Africa Sub-Saharan Africa (excluding high income)Sub-Saharan Africa (IDA & IBRD countries)SudanSurinameSwazilandSwedenSwitzerlandSyrian Arab RepublicTajikistanTanzaniaThailandTimor-LesteTogoTongaTrinidad and TobagoTunisiaTurkeyTurkmenistanTuvaluUgandaUkraineUnited Arab EmiratesUnited KingdomUnited StatesUpper middle incomeUruguayUzbekistanVanuatuVenezuela, RBVietnamVirgin Islands (U.S.)West Bank and GazaWorldYemen, Rep.ZambiaZimbabwe Timeline:
This timeline shows a graph from 1964 to 2016 of Sri Lanka. No data until 1963. Number of actual observations by date: 53.
Source name:
World Development Indicators
Source organization:
World Bank national accounts data, and OECD National Accounts data files.
Categories, topics:
Economy & Growth
Last updated:
apr 23, 2017
Indicators value changes by year
Minimum:
1.385 bln
jan 1, 1965
Maximum:
79.604 bln
jan 1, 2016
At the date of observation
Value
Absolute change
Change from previous value
jan 1, 1964
1.406 bln
+1.406 bln
0.0%
jan 1, 1965
1.385 bln
-20.724 mln
-1.47%
jan 1, 1966
1.459 bln
+73.953 mln
5.34%
jan 1, 1967
1.682 bln
+223.449 mln
15.32%
jan 1, 1968
1.929 bln
+246.483 mln
14.65%
jan 1, 1969
1.956 bln
+27.343 mln
1.42%
jan 1, 1970
2.088 bln
+131.76 mln
6.74%
jan 1, 1971
2.074 bln
-14.425 mln
-0.69%
jan 1, 1972
2.165 bln
+91.585 mln
4.42%
jan 1, 1973
2.386 bln
+221.038 mln
10.21%
jan 1, 1974
2.801 bln
+415.245 mln
17.4%
jan 1, 1975
3.346 bln
+544.639 mln
19.44%
jan 1, 1976
3.778 bln
+431.847 mln
12.91%
jan 1, 1977
3.583 bln
-194.522 mln
-5.15%
jan 1, 1978
3.678 bln
+94.804 mln
2.65%
jan 1, 1979
3.478 bln
-200.226 mln
-5.44%
jan 1, 1980
3.904 bln
+426.465 mln
12.26%
jan 1, 1981
4.155 bln
+250.944 mln
6.43%
jan 1, 1982
4.627 bln
+471.473 mln
11.35%
jan 1, 1983
4.866 bln
+238.91 mln
5.16%
jan 1, 1984
4.902 bln
+35.936 mln
0.74%
jan 1, 1985
5.306 bln
+404.346 mln
8.25%
jan 1, 1986
5.95 bln
+643.581 mln
12.13%
jan 1, 1987
6.646 bln
+696.692 mln
11.71%
jan 1, 1988
7.124 bln
+477.736 mln
7.19%
jan 1, 1989
7.682 bln
+557.761 mln
7.83%
jan 1, 1990
7.59 bln
-91.598 mln
-1.19%
jan 1, 1991
8.052 bln
+462.15 mln
6.09%
jan 1, 1992
8.659 bln
+606.95 mln
7.54%
jan 1, 1993
9.73 bln
+1.071 bln
12.37%
jan 1, 1994
10.685 bln
+954.277 mln
9.81%
jan 1, 1995
11.536 bln
+850.942 mln
7.96%
jan 1, 1996
12.64 bln
+1.104 bln
9.57%
jan 1, 1997
13.658 bln
+1.018 bln
8.06%
jan 1, 1998
14.732 bln
+1.074 bln
7.87%
jan 1, 1999
15.137 bln
+404.306 mln
2.74%
jan 1, 2000
15.632 bln
+495.169 mln
3.27%
jan 1, 2001
16.407 bln
+774.855 mln
4.96%
jan 1, 2002
15.694 bln
-713.26 mln
-4.35%
jan 1, 2003
16.101 bln
+407.547 mln
2.6%
jan 1, 2004
18.057 bln
+1.956 bln
12.15%
jan 1, 2005
20.629 bln
+2.572 bln
14.25%
jan 1, 2006
23.69 bln
+3.061 bln
14.84%
jan 1, 2007
26.809 bln
+3.119 bln
13.17%
jan 1, 2008
30.783 bln
+3.974 bln
14.82%
jan 1, 2009
35.804 bln
+5.021 bln
16.31%
jan 1, 2010
40.384 bln
+4.58 bln
12.79%
jan 1, 2011
48.796 bln
+8.412 bln
20.83%
jan 1, 2012
58.047 bln
+9.251 bln
18.96%
jan 1, 2013
68.558 bln
+10.511 bln
18.11%
jan 1, 2014
71.921 bln
+3.363 bln
4.9%
jan 1, 2015
75.777 bln
+3.857 bln
5.36%
jan 1, 2016
79.604 bln
+3.827 bln
5.05%
Ranking of countries by current statistics by years


Comments: