29
/
en
AIzaSyAYiBZKx7MnpbEhh9jyipgxe19OcubqV5w
April 1, 2024
209344
New Zealand
NZL
true
2
1
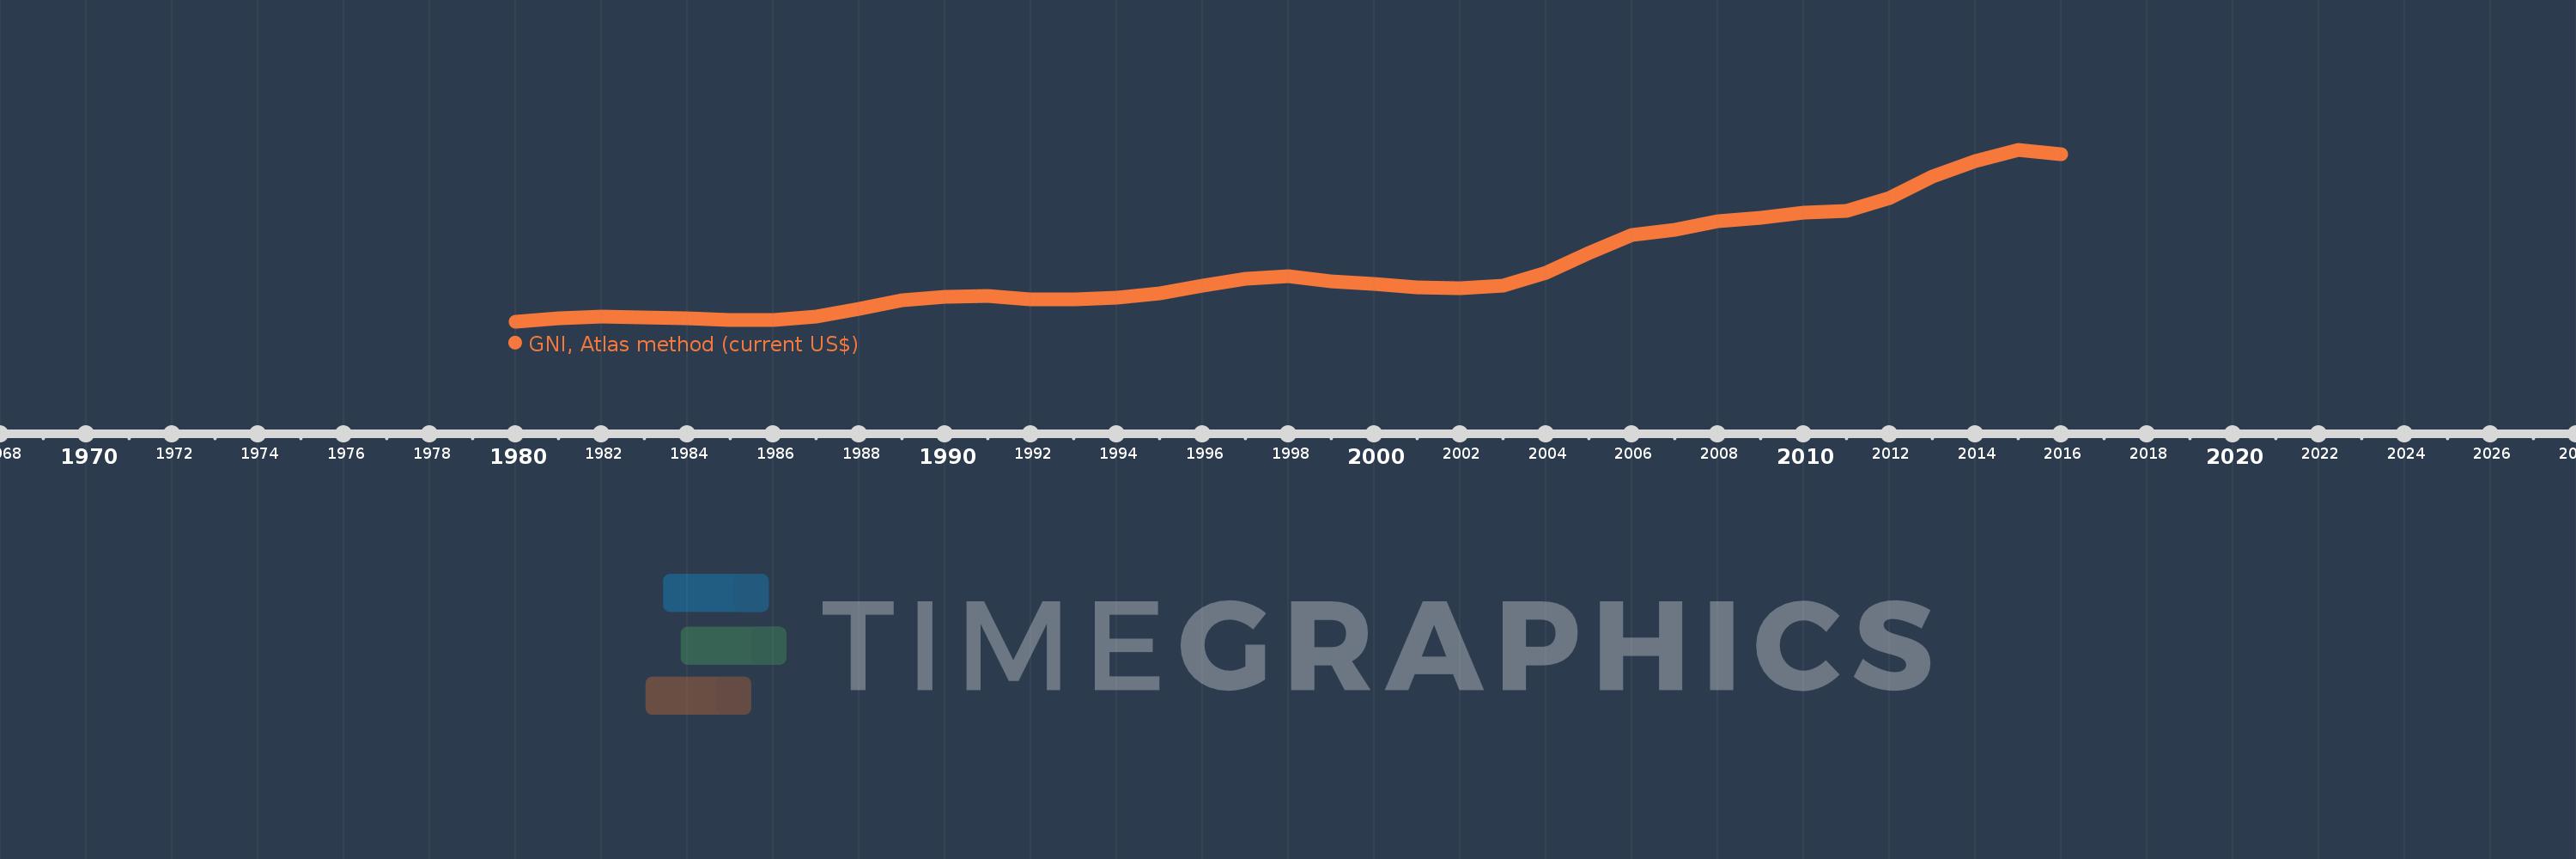
GNI, Atlas method (current US$)
2016,2015,2014,2013,2012,2011,2010,2009,2008,2007,2006,2005,2004,2003,2002,2001,2000,1999,1998,1997,1996,1995,1994,1993,1992,1991,1990,1989,1988,1987,1986,1985,1984,1983,1982,1981,1980
This statistics in other country:
AfghanistanAlbaniaAlgeriaAndorraAngolaAntigua and BarbudaArab WorldArgentinaArmeniaAustraliaAustriaAzerbaijanBahamas, TheBahrainBangladeshBarbadosBelarusBelgiumBelizeBeninBermudaBhutanBoliviaBosnia and HerzegovinaBotswanaBrazilBrunei DarussalamBulgariaBurkina FasoBurundiCabo VerdeCambodiaCameroonCanadaCaribbean small statesCentral African RepublicCentral Europe and the BalticsChadChannel IslandsChileChinaColombiaComorosCongo, Dem. Rep.Congo, Rep.Costa RicaCote d'IvoireCroatiaCubaCyprusCzech RepublicDenmarkDjiboutiDominicaDominican RepublicEarly-demographic dividendEast Asia & PacificEast Asia & Pacific (excluding high income)East Asia & Pacific (IDA & IBRD countries)EcuadorEgypt, Arab Rep.El SalvadorEquatorial GuineaEritreaEstoniaEthiopiaEuro areaEurope & Central AsiaEurope & Central Asia (excluding high income)Europe & Central Asia (IDA & IBRD countries)European UnionFijiFinlandFragile and conflict affected situationsFranceFrench PolynesiaGabonGambia, TheGeorgiaGermanyGhanaGreeceGreenlandGrenadaGuatemalaGuineaGuinea-BissauGuyanaHaitiHeavily indebted poor countries (HIPC)High incomeHondurasHong Kong SAR, ChinaHungaryIBRD onlyIcelandIDA & IBRD totalIDA blendIDA onlyIDA totalIndiaIndonesiaIran, Islamic Rep.IraqIrelandIsle of ManIsraelItalyJamaicaJapanJordanKazakhstanKenyaKiribatiKorea, Rep.KosovoKuwaitKyrgyz RepublicLao PDRLate-demographic dividendLatin America & Caribbean Latin America & Caribbean (excluding high income)Latin America & the Caribbean (IDA & IBRD countries)LatviaLeast developed countries: UN classificationLebanonLesothoLiberiaLibyaLiechtensteinLithuaniaLow & middle incomeLow incomeLower middle incomeLuxembourgMacao SAR, ChinaMacedonia, FYRMadagascarMalawiMalaysiaMaldivesMaliMaltaMarshall IslandsMauritaniaMauritiusMexicoMicronesia, Fed. Sts.Middle East & North AfricaMiddle East & North Africa (excluding high income)Middle East & North Africa (IDA & IBRD countries)Middle incomeMoldovaMonacoMongoliaMontenegroMoroccoMozambiqueMyanmarNamibiaNauruNepalNetherlandsNew CaledoniaNew ZealandNicaraguaNigerNigeriaNorth AmericaNorwayOECD membersOmanOther small statesPacific island small statesPakistanPalauPanamaPapua New GuineaParaguayPeruPhilippinesPolandPortugalPost-demographic dividendPre-demographic dividendPuerto RicoQatarRomaniaRussian FederationRwandaSamoaSan MarinoSao Tome and PrincipeSaudi ArabiaSenegalSerbiaSeychellesSierra LeoneSingaporeSlovak RepublicSloveniaSmall statesSolomon IslandsSouth AfricaSouth AsiaSouth Asia (IDA & IBRD)South SudanSpainSri LankaSt. Kitts and NevisSt. LuciaSt. Vincent and the GrenadinesSub-Saharan Africa Sub-Saharan Africa (excluding high income)Sub-Saharan Africa (IDA & IBRD countries)SudanSurinameSwazilandSwedenSwitzerlandSyrian Arab RepublicTajikistanTanzaniaThailandTimor-LesteTogoTongaTrinidad and TobagoTunisiaTurkeyTurkmenistanTuvaluUgandaUkraineUnited Arab EmiratesUnited KingdomUnited StatesUpper middle incomeUruguayUzbekistanVanuatuVenezuela, RBVietnamVirgin Islands (U.S.)West Bank and GazaWorldYemen, Rep.ZambiaZimbabwe Timeline:
This timeline shows a graph from 1980 to 2016 of New Zealand. No data until 1979. Number of actual observations by date: 37.
Source name:
World Development Indicators
Source organization:
World Bank national accounts data, and OECD National Accounts data files.
Categories, topics:
Economy & Growth
Last updated:
apr 23, 2017
Indicators value changes by year
Minimum:
20.301 bln
jan 1, 1980
Maximum:
187.924 bln
jan 1, 2015
At the date of observation
Value
Absolute change
Change from previous value
jan 1, 1980
20.301 bln
+20.301 bln
0.0%
jan 1, 1981
23.877 bln
+3.576 bln
17.61%
jan 1, 1982
25.746 bln
+1.869 bln
7.83%
jan 1, 1983
24.795 bln
-951.634 mln
-3.7%
jan 1, 1984
23.593 bln
-1.202 bln
-4.85%
jan 1, 1985
22.618 bln
-974.886 mln
-4.13%
jan 1, 1986
22.567 bln
-50.808 mln
-0.22%
jan 1, 1987
25.518 bln
+2.951 bln
13.08%
jan 1, 1988
32.777 bln
+7.259 bln
28.45%
jan 1, 1989
41.205 bln
+8.428 bln
25.71%
jan 1, 1990
44.772 bln
+3.567 bln
8.66%
jan 1, 1991
45.426 bln
+653.838 mln
1.46%
jan 1, 1992
42.485 bln
-2.941 bln
-6.47%
jan 1, 1993
42.566 bln
+81.383 mln
0.19%
jan 1, 1994
44.164 bln
+1.598 bln
3.75%
jan 1, 1995
48.523 bln
+4.358 bln
9.87%
jan 1, 1996
56.091 bln
+7.568 bln
15.6%
jan 1, 1997
62.404 bln
+6.313 bln
11.25%
jan 1, 1998
64.872 bln
+2.468 bln
3.96%
jan 1, 1999
60.137 bln
-4.735 bln
-7.3%
jan 1, 2000
57.67 bln
-2.466 bln
-4.1%
jan 1, 2001
54.28 bln
-3.39 bln
-5.88%
jan 1, 2002
53.561 bln
-718.383 mln
-1.32%
jan 1, 2003
56.034 bln
+2.473 bln
4.62%
jan 1, 2004
68.408 bln
+12.374 bln
22.08%
jan 1, 2005
87.791 bln
+19.383 bln
28.34%
jan 1, 2006
105.149 bln
+17.358 bln
19.77%
jan 1, 2007
110.559 bln
+5.41 bln
5.15%
jan 1, 2008
118.862 bln
+8.303 bln
7.51%
jan 1, 2009
121.836 bln
+2.974 bln
2.5%
jan 1, 2010
127.393 bln
+5.558 bln
4.56%
jan 1, 2011
128.872 bln
+1.478 bln
1.16%
jan 1, 2012
141.484 bln
+12.613 bln
9.79%
jan 1, 2013
162.232 bln
+20.748 bln
14.66%
jan 1, 2014
177.602 bln
+15.369 bln
9.47%
jan 1, 2015
187.924 bln
+10.323 bln
5.81%
jan 1, 2016
183.91 bln
-4.014 bln
-2.14%
Ranking of countries by current statistics by years


Comments: