29
/
en
AIzaSyAYiBZKx7MnpbEhh9jyipgxe19OcubqV5w
April 1, 2024
85141
Bermuda
BMU
true
2
1
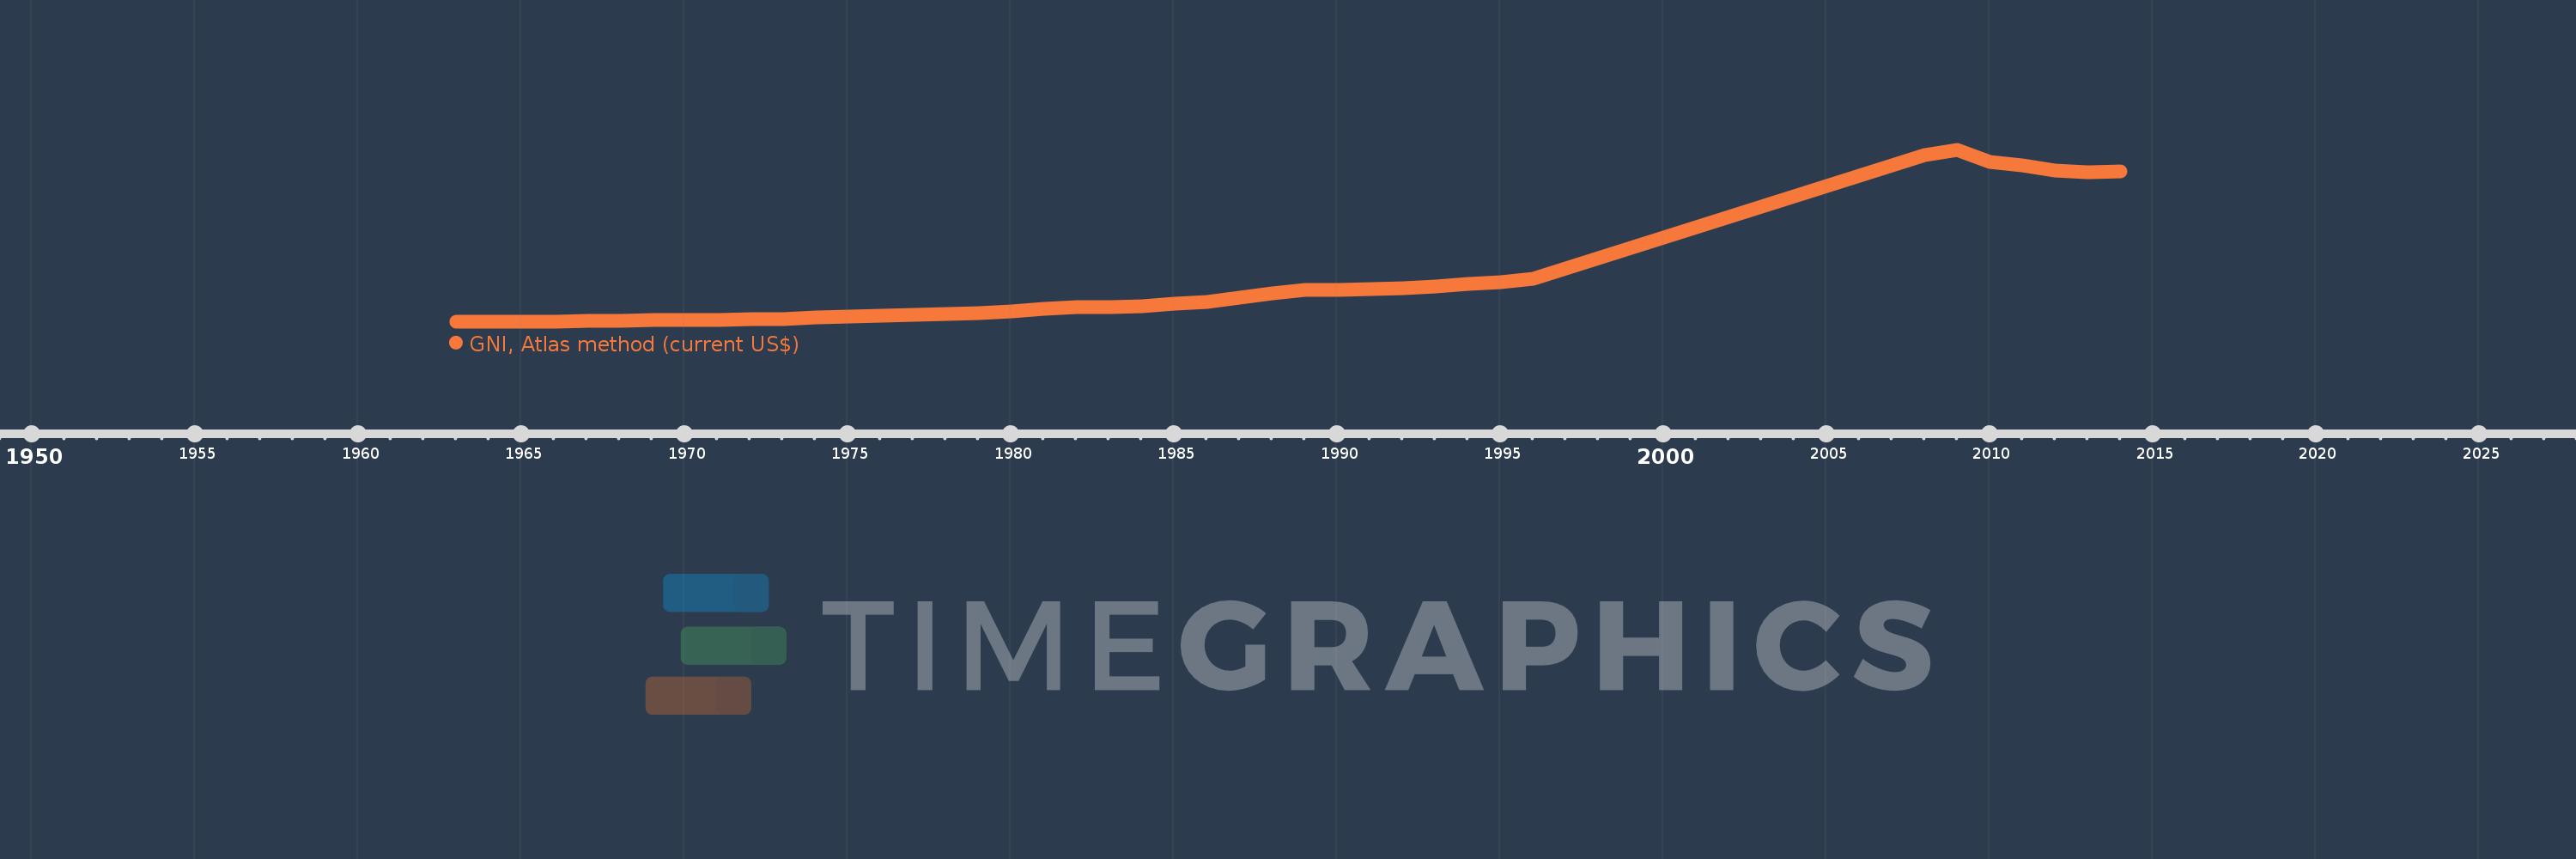
GNI, Atlas method (current US$)
2014,2013,2012,2011,2010,2009,2008,1996,1995,1994,1993,1992,1991,1990,1989,1988,1987,1986,1985,1984,1983,1982,1981,1980,1979,1978,1977,1976,1975,1974,1973,1972,1971,1970,1969,1968,1967,1966,1965,1964,1963
This statistics in other country:
AfghanistanAlbaniaAlgeriaAndorraAngolaAntigua and BarbudaArab WorldArgentinaArmeniaAustraliaAustriaAzerbaijanBahamas, TheBahrainBangladeshBarbadosBelarusBelgiumBelizeBeninBermudaBhutanBoliviaBosnia and HerzegovinaBotswanaBrazilBrunei DarussalamBulgariaBurkina FasoBurundiCabo VerdeCambodiaCameroonCanadaCaribbean small statesCentral African RepublicCentral Europe and the BalticsChadChannel IslandsChileChinaColombiaComorosCongo, Dem. Rep.Congo, Rep.Costa RicaCote d'IvoireCroatiaCubaCyprusCzech RepublicDenmarkDjiboutiDominicaDominican RepublicEarly-demographic dividendEast Asia & PacificEast Asia & Pacific (excluding high income)East Asia & Pacific (IDA & IBRD countries)EcuadorEgypt, Arab Rep.El SalvadorEquatorial GuineaEritreaEstoniaEthiopiaEuro areaEurope & Central AsiaEurope & Central Asia (excluding high income)Europe & Central Asia (IDA & IBRD countries)European UnionFijiFinlandFragile and conflict affected situationsFranceFrench PolynesiaGabonGambia, TheGeorgiaGermanyGhanaGreeceGreenlandGrenadaGuatemalaGuineaGuinea-BissauGuyanaHaitiHeavily indebted poor countries (HIPC)High incomeHondurasHong Kong SAR, ChinaHungaryIBRD onlyIcelandIDA & IBRD totalIDA blendIDA onlyIDA totalIndiaIndonesiaIran, Islamic Rep.IraqIrelandIsle of ManIsraelItalyJamaicaJapanJordanKazakhstanKenyaKiribatiKorea, Rep.KosovoKuwaitKyrgyz RepublicLao PDRLate-demographic dividendLatin America & Caribbean Latin America & Caribbean (excluding high income)Latin America & the Caribbean (IDA & IBRD countries)LatviaLeast developed countries: UN classificationLebanonLesothoLiberiaLibyaLiechtensteinLithuaniaLow & middle incomeLow incomeLower middle incomeLuxembourgMacao SAR, ChinaMacedonia, FYRMadagascarMalawiMalaysiaMaldivesMaliMaltaMarshall IslandsMauritaniaMauritiusMexicoMicronesia, Fed. Sts.Middle East & North AfricaMiddle East & North Africa (excluding high income)Middle East & North Africa (IDA & IBRD countries)Middle incomeMoldovaMonacoMongoliaMontenegroMoroccoMozambiqueMyanmarNamibiaNauruNepalNetherlandsNew CaledoniaNew ZealandNicaraguaNigerNigeriaNorth AmericaNorwayOECD membersOmanOther small statesPacific island small statesPakistanPalauPanamaPapua New GuineaParaguayPeruPhilippinesPolandPortugalPost-demographic dividendPre-demographic dividendPuerto RicoQatarRomaniaRussian FederationRwandaSamoaSan MarinoSao Tome and PrincipeSaudi ArabiaSenegalSerbiaSeychellesSierra LeoneSingaporeSlovak RepublicSloveniaSmall statesSolomon IslandsSouth AfricaSouth AsiaSouth Asia (IDA & IBRD)South SudanSpainSri LankaSt. Kitts and NevisSt. LuciaSt. Vincent and the GrenadinesSub-Saharan Africa Sub-Saharan Africa (excluding high income)Sub-Saharan Africa (IDA & IBRD countries)SudanSurinameSwazilandSwedenSwitzerlandSyrian Arab RepublicTajikistanTanzaniaThailandTimor-LesteTogoTongaTrinidad and TobagoTunisiaTurkeyTurkmenistanTuvaluUgandaUkraineUnited Arab EmiratesUnited KingdomUnited StatesUpper middle incomeUruguayUzbekistanVanuatuVenezuela, RBVietnamVirgin Islands (U.S.)West Bank and GazaWorldYemen, Rep.ZambiaZimbabwe Timeline:
This timeline shows a graph from 1963 to 2014 of Bermuda. No data until 1962. Number of actual observations by date: 41.
Source name:
World Development Indicators
Source organization:
World Bank national accounts data, and OECD National Accounts data files.
Categories, topics:
Economy & Growth
Last updated:
apr 23, 2017
Indicators value changes by year
Minimum:
101.021 mln
jan 1, 1963
Maximum:
7.865 bln
jan 1, 2009
At the date of observation
Value
Absolute change
Change from previous value
jan 1, 1963
101.021 mln
+101.021 mln
0.0%
jan 1, 1964
103.134 mln
+2.113 mln
2.09%
jan 1, 1965
115.559 mln
+12.425 mln
12.05%
jan 1, 1966
123.406 mln
+7.847 mln
6.79%
jan 1, 1967
144.471 mln
+21.064 mln
17.07%
jan 1, 1968
166.796 mln
+22.325 mln
15.45%
jan 1, 1969
171.698 mln
+4.902 mln
2.94%
jan 1, 1970
180.439 mln
+8.741 mln
5.09%
jan 1, 1971
196.388 mln
+15.95 mln
8.84%
jan 1, 1972
219.088 mln
+22.7 mln
11.56%
jan 1, 1973
246.374 mln
+27.285 mln
12.45%
jan 1, 1974
291.945 mln
+45.571 mln
18.5%
jan 1, 1975
346.454 mln
+54.51 mln
18.67%
jan 1, 1976
401.303 mln
+54.848 mln
15.83%
jan 1, 1977
441.159 mln
+39.856 mln
9.93%
jan 1, 1978
478.239 mln
+37.08 mln
8.41%
jan 1, 1979
518.831 mln
+40.592 mln
8.49%
jan 1, 1980
575.772 mln
+56.941 mln
10.97%
jan 1, 1981
699.066 mln
+123.294 mln
21.41%
jan 1, 1982
777.336 mln
+78.271 mln
11.2%
jan 1, 1983
759.981 mln
-17.356 mln
-2.23%
jan 1, 1984
829.158 mln
+69.177 mln
9.1%
jan 1, 1985
931.452 mln
+102.294 mln
12.34%
jan 1, 1986
1.017 bln
+85.384 mln
9.17%
jan 1, 1987
1.215 bln
+197.906 mln
19.46%
jan 1, 1988
1.39 bln
+175.682 mln
14.46%
jan 1, 1989
1.553 bln
+162.561 mln
11.69%
jan 1, 1990
1.56 bln
+6.553 mln
0.42%
jan 1, 1991
1.605 bln
+45.942 mln
2.95%
jan 1, 1992
1.617 bln
+11.496 mln
0.72%
jan 1, 1993
1.699 bln
+82.124 mln
5.08%
jan 1, 1994
1.82 bln
+120.67 mln
7.1%
jan 1, 1995
1.882 bln
+62.305 mln
3.42%
jan 1, 1996
2.049 bln
+166.786 mln
8.86%
jan 1, 2008
7.633 bln
+5.585 bln
272.57%
jan 1, 2009
7.865 bln
+231.289 mln
3.03%
jan 1, 2010
7.324 bln
-541.111 mln
-6.88%
jan 1, 2011
7.193 bln
-131.163 mln
-1.79%
jan 1, 2012
6.942 bln
-250.058 mln
-3.48%
jan 1, 2013
6.874 bln
-68.763 mln
-0.99%
jan 1, 2014
6.899 bln
+25.769 mln
0.37%
Ranking of countries by current statistics by years


Comments: