29
/
en
AIzaSyAYiBZKx7MnpbEhh9jyipgxe19OcubqV5w
April 1, 2024
202949
Mozambique
MOZ
true
2
1
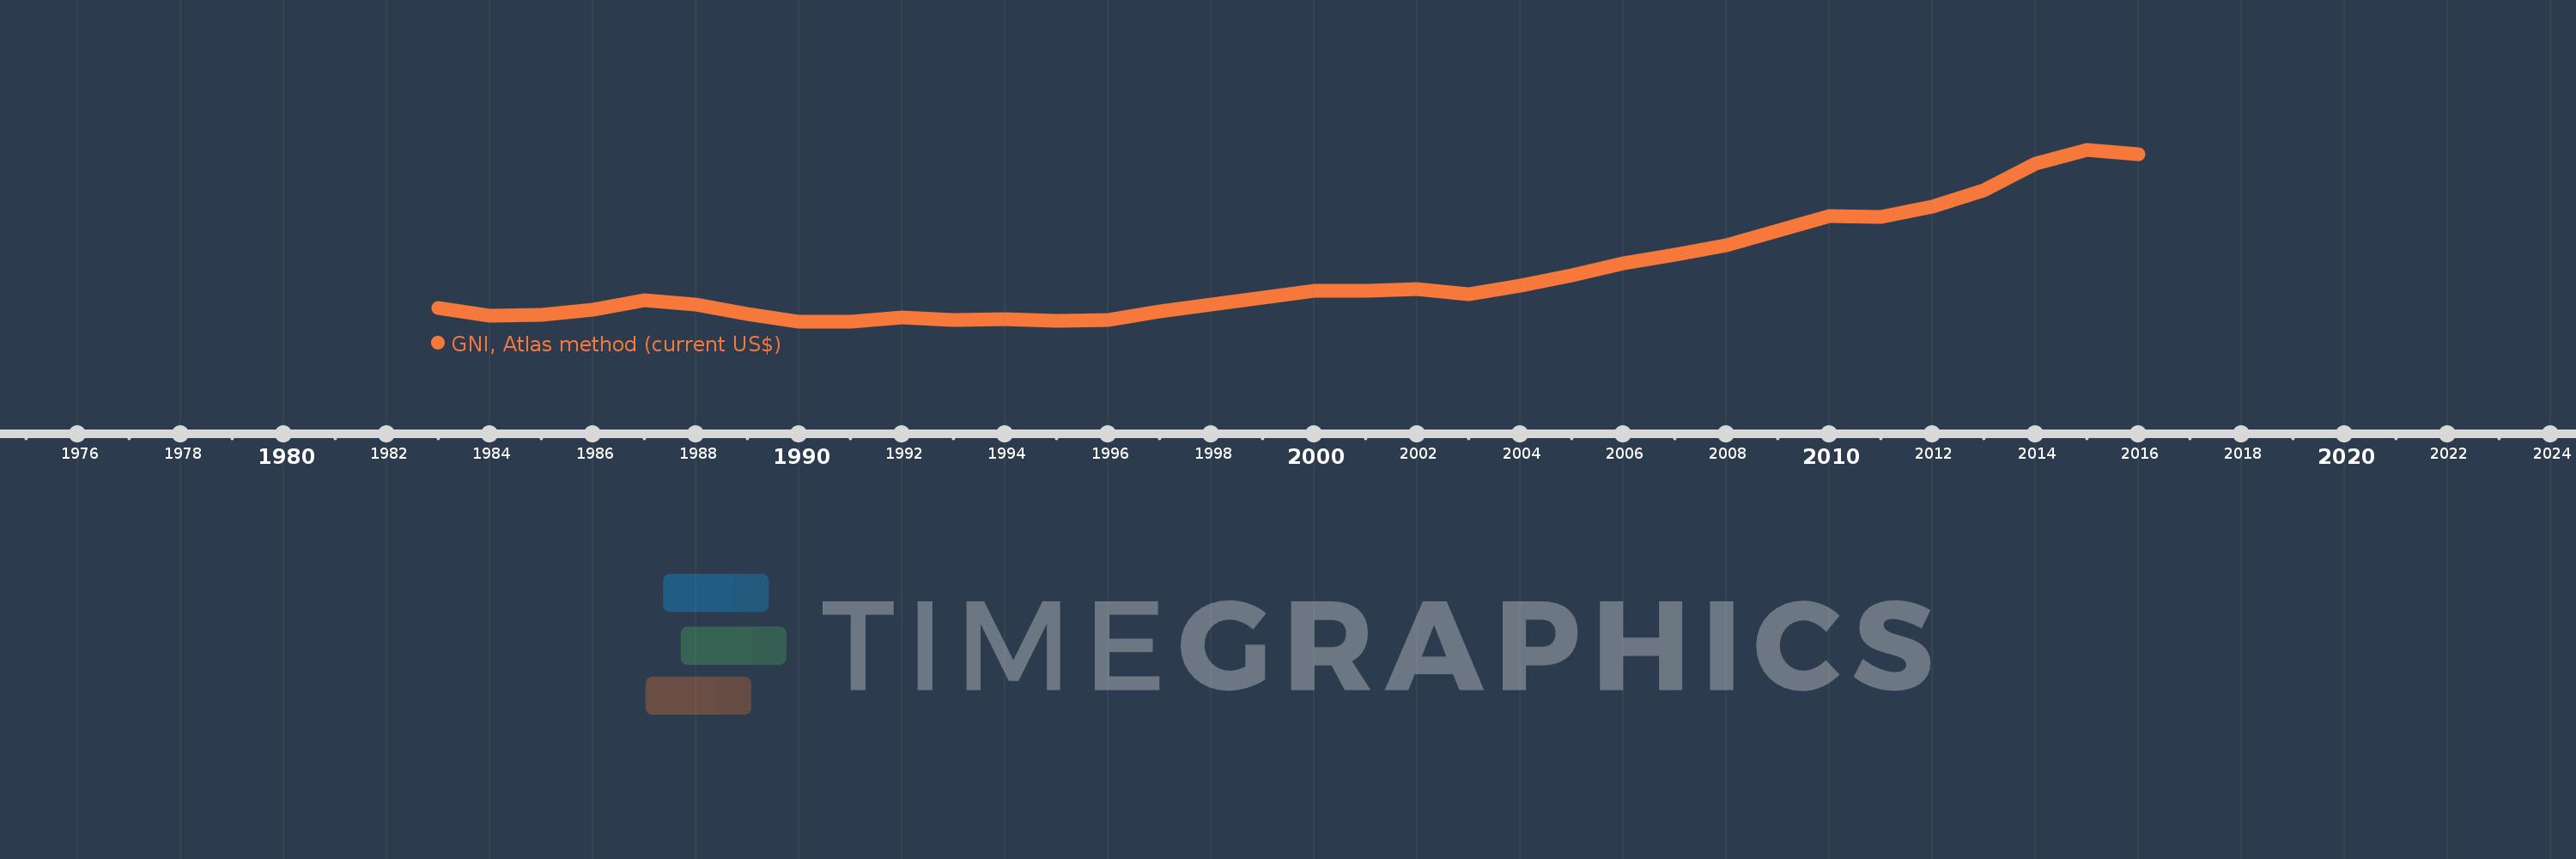
GNI, Atlas method (current US$)
2016,2015,2014,2013,2012,2011,2010,2009,2008,2007,2006,2005,2004,2003,2002,2001,2000,1999,1998,1997,1996,1995,1994,1993,1992,1991,1990,1989,1988,1987,1986,1985,1984,1983
This statistics in other country:
AfghanistanAlbaniaAlgeriaAndorraAngolaAntigua and BarbudaArab WorldArgentinaArmeniaAustraliaAustriaAzerbaijanBahamas, TheBahrainBangladeshBarbadosBelarusBelgiumBelizeBeninBermudaBhutanBoliviaBosnia and HerzegovinaBotswanaBrazilBrunei DarussalamBulgariaBurkina FasoBurundiCabo VerdeCambodiaCameroonCanadaCaribbean small statesCentral African RepublicCentral Europe and the BalticsChadChannel IslandsChileChinaColombiaComorosCongo, Dem. Rep.Congo, Rep.Costa RicaCote d'IvoireCroatiaCubaCyprusCzech RepublicDenmarkDjiboutiDominicaDominican RepublicEarly-demographic dividendEast Asia & PacificEast Asia & Pacific (excluding high income)East Asia & Pacific (IDA & IBRD countries)EcuadorEgypt, Arab Rep.El SalvadorEquatorial GuineaEritreaEstoniaEthiopiaEuro areaEurope & Central AsiaEurope & Central Asia (excluding high income)Europe & Central Asia (IDA & IBRD countries)European UnionFijiFinlandFragile and conflict affected situationsFranceFrench PolynesiaGabonGambia, TheGeorgiaGermanyGhanaGreeceGreenlandGrenadaGuatemalaGuineaGuinea-BissauGuyanaHaitiHeavily indebted poor countries (HIPC)High incomeHondurasHong Kong SAR, ChinaHungaryIBRD onlyIcelandIDA & IBRD totalIDA blendIDA onlyIDA totalIndiaIndonesiaIran, Islamic Rep.IraqIrelandIsle of ManIsraelItalyJamaicaJapanJordanKazakhstanKenyaKiribatiKorea, Rep.KosovoKuwaitKyrgyz RepublicLao PDRLate-demographic dividendLatin America & Caribbean Latin America & Caribbean (excluding high income)Latin America & the Caribbean (IDA & IBRD countries)LatviaLeast developed countries: UN classificationLebanonLesothoLiberiaLibyaLiechtensteinLithuaniaLow & middle incomeLow incomeLower middle incomeLuxembourgMacao SAR, ChinaMacedonia, FYRMadagascarMalawiMalaysiaMaldivesMaliMaltaMarshall IslandsMauritaniaMauritiusMexicoMicronesia, Fed. Sts.Middle East & North AfricaMiddle East & North Africa (excluding high income)Middle East & North Africa (IDA & IBRD countries)Middle incomeMoldovaMonacoMongoliaMontenegroMoroccoMozambiqueMyanmarNamibiaNauruNepalNetherlandsNew CaledoniaNew ZealandNicaraguaNigerNigeriaNorth AmericaNorwayOECD membersOmanOther small statesPacific island small statesPakistanPalauPanamaPapua New GuineaParaguayPeruPhilippinesPolandPortugalPost-demographic dividendPre-demographic dividendPuerto RicoQatarRomaniaRussian FederationRwandaSamoaSan MarinoSao Tome and PrincipeSaudi ArabiaSenegalSerbiaSeychellesSierra LeoneSingaporeSlovak RepublicSloveniaSmall statesSolomon IslandsSouth AfricaSouth AsiaSouth Asia (IDA & IBRD)South SudanSpainSri LankaSt. Kitts and NevisSt. LuciaSt. Vincent and the GrenadinesSub-Saharan Africa Sub-Saharan Africa (excluding high income)Sub-Saharan Africa (IDA & IBRD countries)SudanSurinameSwazilandSwedenSwitzerlandSyrian Arab RepublicTajikistanTanzaniaThailandTimor-LesteTogoTongaTrinidad and TobagoTunisiaTurkeyTurkmenistanTuvaluUgandaUkraineUnited Arab EmiratesUnited KingdomUnited StatesUpper middle incomeUruguayUzbekistanVanuatuVenezuela, RBVietnamVirgin Islands (U.S.)West Bank and GazaWorldYemen, Rep.ZambiaZimbabwe Timeline:
This timeline shows a graph from 1983 to 2016 of Mozambique. No data until 1982. Number of actual observations by date: 34.
Source name:
World Development Indicators
Source organization:
World Bank national accounts data, and OECD National Accounts data files.
Categories, topics:
Economy & Growth
Last updated:
apr 23, 2017
Indicators value changes by year
Minimum:
2.405 bln
jan 1, 1991
Maximum:
16.809 bln
jan 1, 2015
At the date of observation
Value
Absolute change
Change from previous value
jan 1, 1983
3.586 bln
+3.586 bln
0.0%
jan 1, 1984
2.938 bln
-648.422 mln
-18.08%
jan 1, 1985
2.968 bln
+29.934 mln
1.02%
jan 1, 1986
3.457 bln
+489.81 mln
16.5%
jan 1, 1987
4.243 bln
+785.875 mln
22.73%
jan 1, 1988
3.853 bln
-390.66 mln
-9.21%
jan 1, 1989
3.071 bln
-781.811 mln
-20.29%
jan 1, 1990
2.455 bln
-615.399 mln
-20.04%
jan 1, 1991
2.405 bln
-50.79 mln
-2.07%
jan 1, 1992
2.774 bln
+369.75 mln
15.38%
jan 1, 1993
2.549 bln
-225.882 mln
-8.14%
jan 1, 1994
2.633 bln
+84.222 mln
3.3%
jan 1, 1995
2.497 bln
-135.755 mln
-5.16%
jan 1, 1996
2.536 bln
+38.986 mln
1.56%
jan 1, 1997
3.319 bln
+783.172 mln
30.88%
jan 1, 1998
3.836 bln
+517.283 mln
15.58%
jan 1, 1999
4.432 bln
+595.827 mln
15.53%
jan 1, 2000
5.006 bln
+573.679 mln
12.94%
jan 1, 2001
5.027 bln
+20.712 mln
0.41%
jan 1, 2002
5.163 bln
+136.754 mln
2.72%
jan 1, 2003
4.713 bln
-450.473 mln
-8.72%
jan 1, 2004
5.427 bln
+714.059 mln
15.15%
jan 1, 2005
6.28 bln
+852.734 mln
15.71%
jan 1, 2006
7.35 bln
+1.07 bln
17.04%
jan 1, 2007
8.034 bln
+684.127 mln
9.31%
jan 1, 2008
8.835 bln
+801.133 mln
9.97%
jan 1, 2009
10.084 bln
+1.249 bln
14.14%
jan 1, 2010
11.253 bln
+1.169 bln
11.59%
jan 1, 2011
11.227 bln
-26.175 mln
-0.23%
jan 1, 2012
12.066 bln
+839.649 mln
7.48%
jan 1, 2013
13.448 bln
+1.381 bln
11.45%
jan 1, 2014
15.658 bln
+2.21 bln
16.44%
jan 1, 2015
16.809 bln
+1.151 bln
7.35%
jan 1, 2016
16.442 bln
-367.717 mln
-2.19%
Ranking of countries by current statistics by years


Comments: