29
/
en
AIzaSyAYiBZKx7MnpbEhh9jyipgxe19OcubqV5w
April 1, 2024
219604
Papua New Guinea
PNG
true
2
1
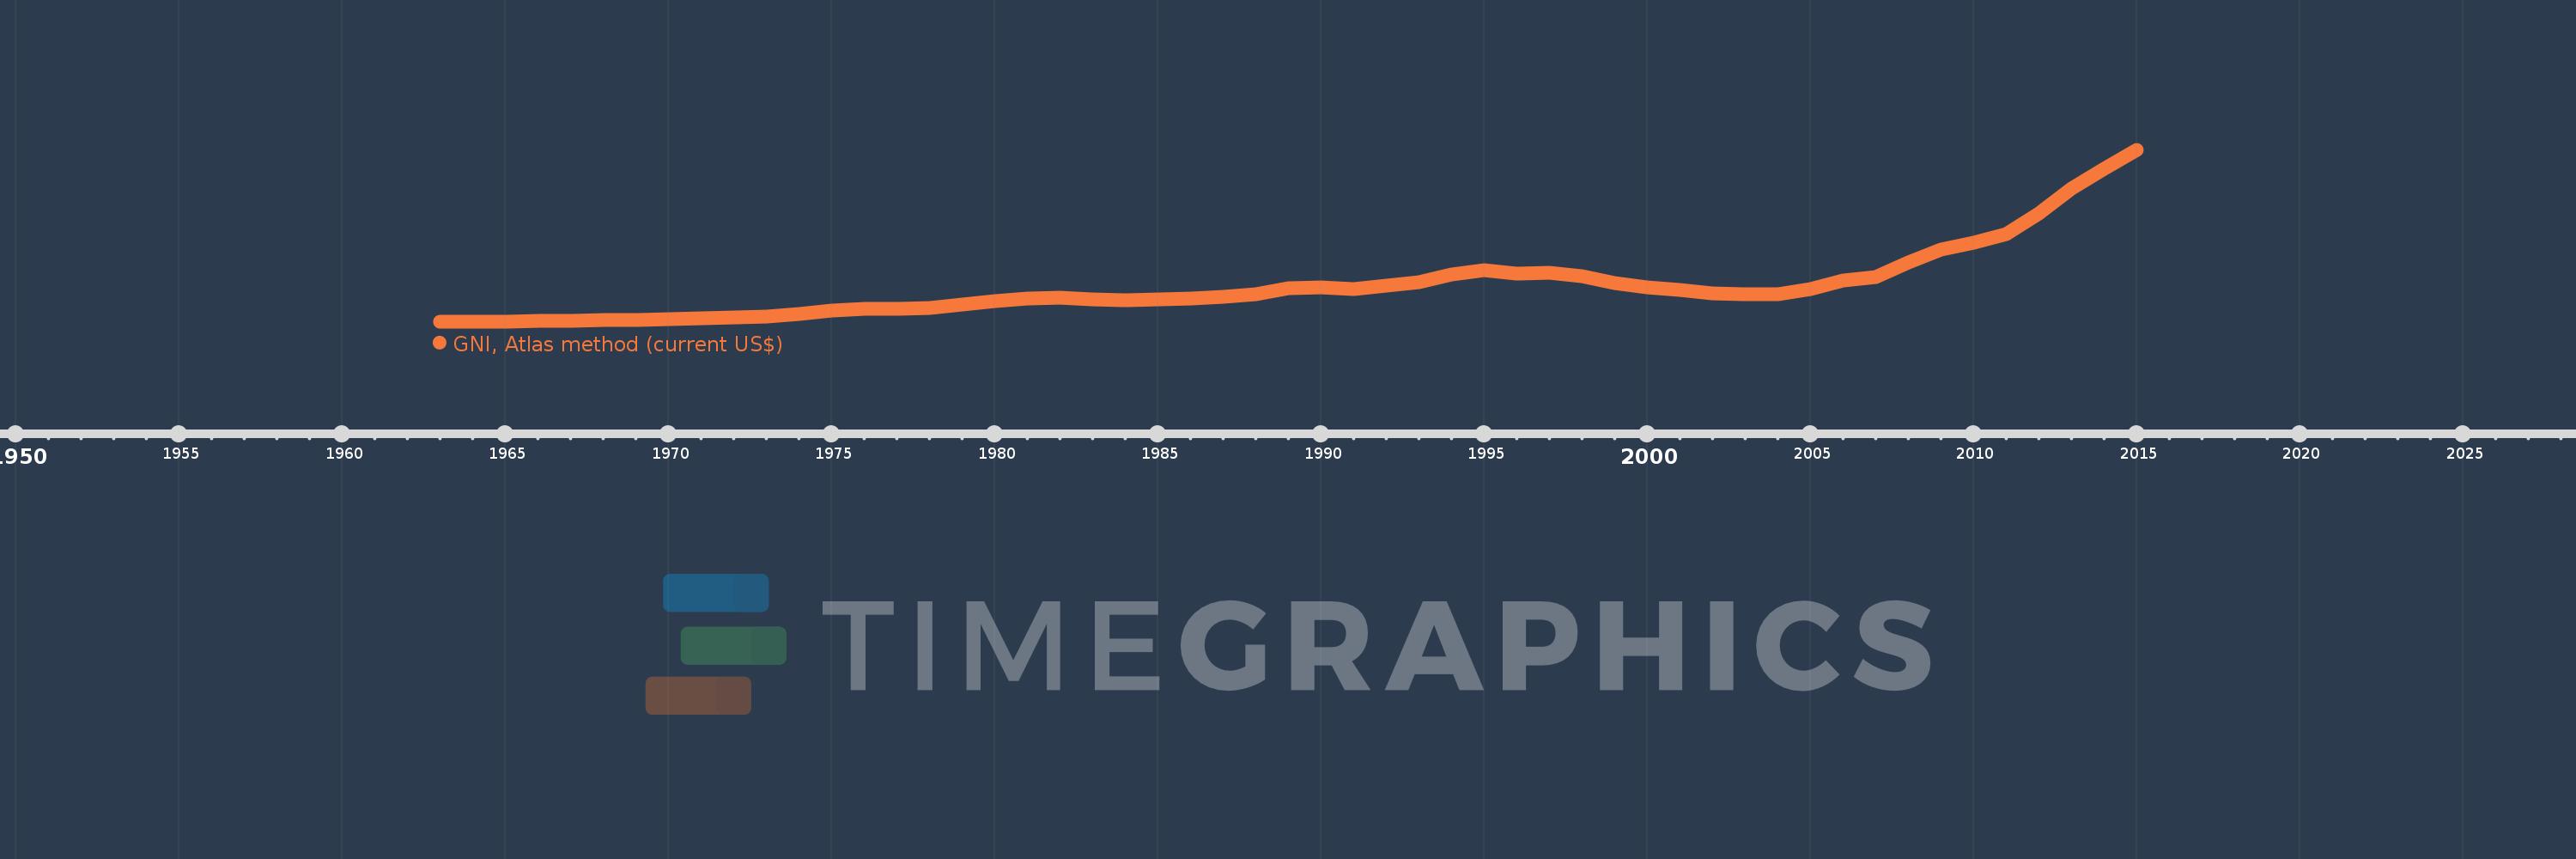
GNI, Atlas method (current US$)
2015,2014,2013,2012,2011,2010,2009,2008,2007,2006,2005,2004,2003,2002,2001,2000,1999,1998,1997,1996,1995,1994,1993,1992,1991,1990,1989,1988,1987,1986,1985,1984,1983,1982,1981,1980,1979,1978,1977,1976,1975,1974,1973,1972,1971,1970,1969,1968,1967,1966,1965,1964,1963
This statistics in other country:
AfghanistanAlbaniaAlgeriaAndorraAngolaAntigua and BarbudaArab WorldArgentinaArmeniaAustraliaAustriaAzerbaijanBahamas, TheBahrainBangladeshBarbadosBelarusBelgiumBelizeBeninBermudaBhutanBoliviaBosnia and HerzegovinaBotswanaBrazilBrunei DarussalamBulgariaBurkina FasoBurundiCabo VerdeCambodiaCameroonCanadaCaribbean small statesCentral African RepublicCentral Europe and the BalticsChadChannel IslandsChileChinaColombiaComorosCongo, Dem. Rep.Congo, Rep.Costa RicaCote d'IvoireCroatiaCubaCyprusCzech RepublicDenmarkDjiboutiDominicaDominican RepublicEarly-demographic dividendEast Asia & PacificEast Asia & Pacific (excluding high income)East Asia & Pacific (IDA & IBRD countries)EcuadorEgypt, Arab Rep.El SalvadorEquatorial GuineaEritreaEstoniaEthiopiaEuro areaEurope & Central AsiaEurope & Central Asia (excluding high income)Europe & Central Asia (IDA & IBRD countries)European UnionFijiFinlandFragile and conflict affected situationsFranceFrench PolynesiaGabonGambia, TheGeorgiaGermanyGhanaGreeceGreenlandGrenadaGuatemalaGuineaGuinea-BissauGuyanaHaitiHeavily indebted poor countries (HIPC)High incomeHondurasHong Kong SAR, ChinaHungaryIBRD onlyIcelandIDA & IBRD totalIDA blendIDA onlyIDA totalIndiaIndonesiaIran, Islamic Rep.IraqIrelandIsle of ManIsraelItalyJamaicaJapanJordanKazakhstanKenyaKiribatiKorea, Rep.KosovoKuwaitKyrgyz RepublicLao PDRLate-demographic dividendLatin America & Caribbean Latin America & Caribbean (excluding high income)Latin America & the Caribbean (IDA & IBRD countries)LatviaLeast developed countries: UN classificationLebanonLesothoLiberiaLibyaLiechtensteinLithuaniaLow & middle incomeLow incomeLower middle incomeLuxembourgMacao SAR, ChinaMacedonia, FYRMadagascarMalawiMalaysiaMaldivesMaliMaltaMarshall IslandsMauritaniaMauritiusMexicoMicronesia, Fed. Sts.Middle East & North AfricaMiddle East & North Africa (excluding high income)Middle East & North Africa (IDA & IBRD countries)Middle incomeMoldovaMonacoMongoliaMontenegroMoroccoMozambiqueMyanmarNamibiaNauruNepalNetherlandsNew CaledoniaNew ZealandNicaraguaNigerNigeriaNorth AmericaNorwayOECD membersOmanOther small statesPacific island small statesPakistanPalauPanamaPapua New GuineaParaguayPeruPhilippinesPolandPortugalPost-demographic dividendPre-demographic dividendPuerto RicoQatarRomaniaRussian FederationRwandaSamoaSan MarinoSao Tome and PrincipeSaudi ArabiaSenegalSerbiaSeychellesSierra LeoneSingaporeSlovak RepublicSloveniaSmall statesSolomon IslandsSouth AfricaSouth AsiaSouth Asia (IDA & IBRD)South SudanSpainSri LankaSt. Kitts and NevisSt. LuciaSt. Vincent and the GrenadinesSub-Saharan Africa Sub-Saharan Africa (excluding high income)Sub-Saharan Africa (IDA & IBRD countries)SudanSurinameSwazilandSwedenSwitzerlandSyrian Arab RepublicTajikistanTanzaniaThailandTimor-LesteTogoTongaTrinidad and TobagoTunisiaTurkeyTurkmenistanTuvaluUgandaUkraineUnited Arab EmiratesUnited KingdomUnited StatesUpper middle incomeUruguayUzbekistanVanuatuVenezuela, RBVietnamVirgin Islands (U.S.)West Bank and GazaWorldYemen, Rep.ZambiaZimbabwe Timeline:
This timeline shows a graph from 1963 to 2015 of Papua New Guinea. No data until 1962. Number of actual observations by date: 53.
Source name:
World Development Indicators
Source organization:
World Bank national accounts data, and OECD National Accounts data files.
Categories, topics:
Economy & Growth
Last updated:
apr 23, 2017
Indicators value changes by year
Minimum:
263.104 mln
jan 1, 1963
Maximum:
16.724 bln
jan 1, 2015
At the date of observation
Value
Absolute change
Change from previous value
jan 1, 1963
263.104 mln
+263.104 mln
0.0%
jan 1, 1964
275.136 mln
+12.033 mln
4.57%
jan 1, 1965
301.781 mln
+26.644 mln
9.68%
jan 1, 1966
341.851 mln
+40.07 mln
13.28%
jan 1, 1967
379.445 mln
+37.595 mln
11.0%
jan 1, 1968
419.402 mln
+39.957 mln
10.53%
jan 1, 1969
472.248 mln
+52.846 mln
12.6%
jan 1, 1970
543.783 mln
+71.536 mln
15.15%
jan 1, 1971
624.561 mln
+80.777 mln
14.85%
jan 1, 1972
687.224 mln
+62.664 mln
10.03%
jan 1, 1973
795.388 mln
+108.164 mln
15.74%
jan 1, 1974
1.044 bln
+248.312 mln
31.22%
jan 1, 1975
1.344 bln
+300.671 mln
28.81%
jan 1, 1976
1.54 bln
+196.037 mln
14.58%
jan 1, 1977
1.51 bln
-30.063 mln
-1.95%
jan 1, 1978
1.568 bln
+57.67 mln
3.82%
jan 1, 1979
1.922 bln
+353.66 mln
22.55%
jan 1, 1980
2.238 bln
+316.029 mln
16.45%
jan 1, 1981
2.532 bln
+293.93 mln
13.14%
jan 1, 1982
2.625 bln
+92.884 mln
3.67%
jan 1, 1983
2.454 bln
-170.693 mln
-6.5%
jan 1, 1984
2.358 bln
-95.864 mln
-3.91%
jan 1, 1985
2.393 bln
+34.994 mln
1.48%
jan 1, 1986
2.47 bln
+77.209 mln
3.23%
jan 1, 1987
2.68 bln
+209.485 mln
8.48%
jan 1, 1988
2.954 bln
+274.824 mln
10.26%
jan 1, 1989
3.491 bln
+536.527 mln
18.16%
jan 1, 1990
3.604 bln
+112.515 mln
3.22%
jan 1, 1991
3.426 bln
-177.944 mln
-4.94%
jan 1, 1992
3.719 bln
+293.325 mln
8.56%
jan 1, 1993
4.041 bln
+322.472 mln
8.67%
jan 1, 1994
4.83 bln
+788.88 mln
19.52%
jan 1, 1995
5.203 bln
+372.816 mln
7.72%
jan 1, 1996
4.904 bln
-298.748 mln
-5.74%
jan 1, 1997
4.954 bln
+49.468 mln
1.01%
jan 1, 1998
4.622 bln
-331.708 mln
-6.7%
jan 1, 1999
4.003 bln
-619.1 mln
-13.39%
jan 1, 2000
3.601 bln
-402.076 mln
-10.04%
jan 1, 2001
3.321 bln
-280.008 mln
-7.78%
jan 1, 2002
3.036 bln
-284.898 mln
-8.58%
jan 1, 2003
2.909 bln
-127.429 mln
-4.2%
jan 1, 2004
2.918 bln
+9.096 mln
0.31%
jan 1, 2005
3.409 bln
+491.703 mln
16.85%
jan 1, 2006
4.251 bln
+841.362 mln
24.68%
jan 1, 2007
4.567 bln
+316.68 mln
7.45%
jan 1, 2008
5.97 bln
+1.402 bln
30.7%
jan 1, 2009
7.165 bln
+1.195 bln
20.02%
jan 1, 2010
7.884 bln
+719.253 mln
10.04%
jan 1, 2011
8.724 bln
+839.757 mln
10.65%
jan 1, 2012
10.619 bln
+1.896 bln
21.73%
jan 1, 2013
13.006 bln
+2.386 bln
22.47%
jan 1, 2014
14.934 bln
+1.928 bln
14.83%
jan 1, 2015
16.724 bln
+1.791 bln
11.99%
Ranking of countries by current statistics by years


Comments: