29
/
en
AIzaSyAYiBZKx7MnpbEhh9jyipgxe19OcubqV5w
April 1, 2024
250801
St. Lucia
LCA
true
2
1
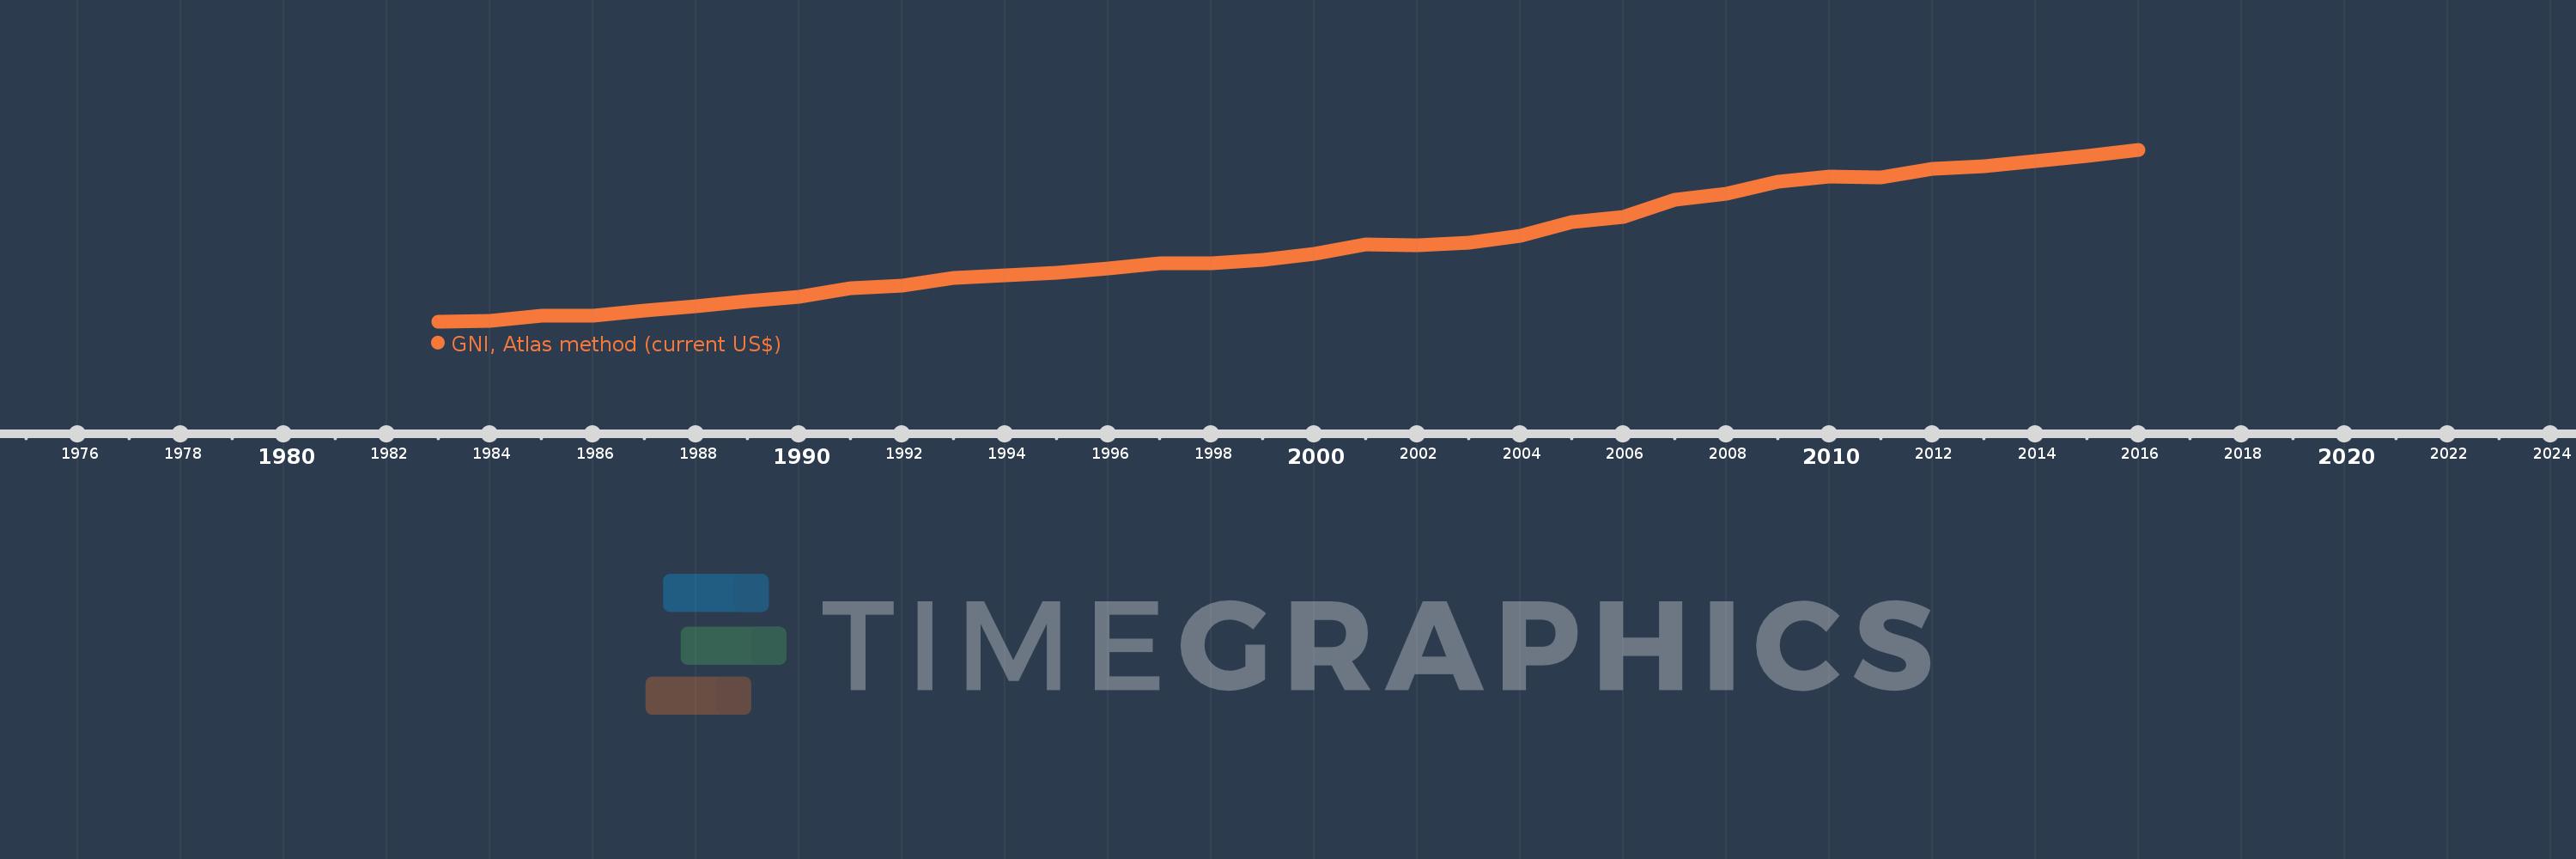
GNI, Atlas method (current US$)
2016,2015,2014,2013,2012,2011,2010,2009,2008,2007,2006,2005,2004,2003,2002,2001,2000,1999,1998,1997,1996,1995,1994,1993,1992,1991,1990,1989,1988,1987,1986,1985,1984,1983
This statistics in other country:
AfghanistanAlbaniaAlgeriaAndorraAngolaAntigua and BarbudaArab WorldArgentinaArmeniaAustraliaAustriaAzerbaijanBahamas, TheBahrainBangladeshBarbadosBelarusBelgiumBelizeBeninBermudaBhutanBoliviaBosnia and HerzegovinaBotswanaBrazilBrunei DarussalamBulgariaBurkina FasoBurundiCabo VerdeCambodiaCameroonCanadaCaribbean small statesCentral African RepublicCentral Europe and the BalticsChadChannel IslandsChileChinaColombiaComorosCongo, Dem. Rep.Congo, Rep.Costa RicaCote d'IvoireCroatiaCubaCyprusCzech RepublicDenmarkDjiboutiDominicaDominican RepublicEarly-demographic dividendEast Asia & PacificEast Asia & Pacific (excluding high income)East Asia & Pacific (IDA & IBRD countries)EcuadorEgypt, Arab Rep.El SalvadorEquatorial GuineaEritreaEstoniaEthiopiaEuro areaEurope & Central AsiaEurope & Central Asia (excluding high income)Europe & Central Asia (IDA & IBRD countries)European UnionFijiFinlandFragile and conflict affected situationsFranceFrench PolynesiaGabonGambia, TheGeorgiaGermanyGhanaGreeceGreenlandGrenadaGuatemalaGuineaGuinea-BissauGuyanaHaitiHeavily indebted poor countries (HIPC)High incomeHondurasHong Kong SAR, ChinaHungaryIBRD onlyIcelandIDA & IBRD totalIDA blendIDA onlyIDA totalIndiaIndonesiaIran, Islamic Rep.IraqIrelandIsle of ManIsraelItalyJamaicaJapanJordanKazakhstanKenyaKiribatiKorea, Rep.KosovoKuwaitKyrgyz RepublicLao PDRLate-demographic dividendLatin America & Caribbean Latin America & Caribbean (excluding high income)Latin America & the Caribbean (IDA & IBRD countries)LatviaLeast developed countries: UN classificationLebanonLesothoLiberiaLibyaLiechtensteinLithuaniaLow & middle incomeLow incomeLower middle incomeLuxembourgMacao SAR, ChinaMacedonia, FYRMadagascarMalawiMalaysiaMaldivesMaliMaltaMarshall IslandsMauritaniaMauritiusMexicoMicronesia, Fed. Sts.Middle East & North AfricaMiddle East & North Africa (excluding high income)Middle East & North Africa (IDA & IBRD countries)Middle incomeMoldovaMonacoMongoliaMontenegroMoroccoMozambiqueMyanmarNamibiaNauruNepalNetherlandsNew CaledoniaNew ZealandNicaraguaNigerNigeriaNorth AmericaNorwayOECD membersOmanOther small statesPacific island small statesPakistanPalauPanamaPapua New GuineaParaguayPeruPhilippinesPolandPortugalPost-demographic dividendPre-demographic dividendPuerto RicoQatarRomaniaRussian FederationRwandaSamoaSan MarinoSao Tome and PrincipeSaudi ArabiaSenegalSerbiaSeychellesSierra LeoneSingaporeSlovak RepublicSloveniaSmall statesSolomon IslandsSouth AfricaSouth AsiaSouth Asia (IDA & IBRD)South SudanSpainSri LankaSt. Kitts and NevisSt. LuciaSt. Vincent and the GrenadinesSub-Saharan Africa Sub-Saharan Africa (excluding high income)Sub-Saharan Africa (IDA & IBRD countries)SudanSurinameSwazilandSwedenSwitzerlandSyrian Arab RepublicTajikistanTanzaniaThailandTimor-LesteTogoTongaTrinidad and TobagoTunisiaTurkeyTurkmenistanTuvaluUgandaUkraineUnited Arab EmiratesUnited KingdomUnited StatesUpper middle incomeUruguayUzbekistanVanuatuVenezuela, RBVietnamVirgin Islands (U.S.)West Bank and GazaWorldYemen, Rep.ZambiaZimbabwe Timeline:
This timeline shows a graph from 1983 to 2016 of St. Lucia. No data until 1982. Number of actual observations by date: 34.
Source name:
World Development Indicators
Source organization:
World Bank national accounts data, and OECD National Accounts data files.
Categories, topics:
Economy & Growth
Last updated:
apr 23, 2017
Indicators value changes by year
Minimum:
139.158 mln
jan 1, 1983
Maximum:
1.36 bln
jan 1, 2016
At the date of observation
Value
Absolute change
Change from previous value
jan 1, 1983
139.158 mln
+139.158 mln
0.0%
jan 1, 1984
145.91 mln
+6.752 mln
4.85%
jan 1, 1985
184.958 mln
+39.048 mln
26.76%
jan 1, 1986
181.154 mln
-3.804 mln
-2.06%
jan 1, 1987
222.68 mln
+41.526 mln
22.92%
jan 1, 1988
248.849 mln
+26.169 mln
11.75%
jan 1, 1989
289.552 mln
+40.703 mln
16.36%
jan 1, 1990
316.823 mln
+27.271 mln
9.42%
jan 1, 1991
376.633 mln
+59.811 mln
18.88%
jan 1, 1992
396.257 mln
+19.624 mln
5.21%
jan 1, 1993
451.035 mln
+54.778 mln
13.82%
jan 1, 1994
469.898 mln
+18.863 mln
4.18%
jan 1, 1995
489.362 mln
+19.463 mln
4.14%
jan 1, 1996
519.891 mln
+30.529 mln
6.24%
jan 1, 1997
554.555 mln
+34.664 mln
6.67%
jan 1, 1998
558.98 mln
+4.425 mln
0.8%
jan 1, 1999
581.506 mln
+22.526 mln
4.03%
jan 1, 2000
622.269 mln
+40.764 mln
7.01%
jan 1, 2001
689.813 mln
+67.543 mln
10.85%
jan 1, 2002
682.403 mln
-7.41 mln
-1.07%
jan 1, 2003
703.619 mln
+21.216 mln
3.11%
jan 1, 2004
753.825 mln
+50.206 mln
7.14%
jan 1, 2005
851.351 mln
+97.526 mln
12.94%
jan 1, 2006
886.703 mln
+35.352 mln
4.15%
jan 1, 2007
1.01 bln
+123.774 mln
13.96%
jan 1, 2008
1.05 bln
+39.327 mln
3.89%
jan 1, 2009
1.136 bln
+86.608 mln
8.25%
jan 1, 2010
1.173 bln
+36.63 mln
3.22%
jan 1, 2011
1.164 bln
-9.35 mln
-0.8%
jan 1, 2012
1.225 bln
+60.935 mln
5.24%
jan 1, 2013
1.246 bln
+20.881 mln
1.71%
jan 1, 2014
1.284 bln
+38.747 mln
3.11%
jan 1, 2015
1.319 bln
+35.004 mln
2.73%
jan 1, 2016
1.36 bln
+40.439 mln
3.07%
Ranking of countries by current statistics by years


Comments: