29
/
en
AIzaSyAYiBZKx7MnpbEhh9jyipgxe19OcubqV5w
April 1, 2024
208727
New Caledonia
NCL
true
2
1
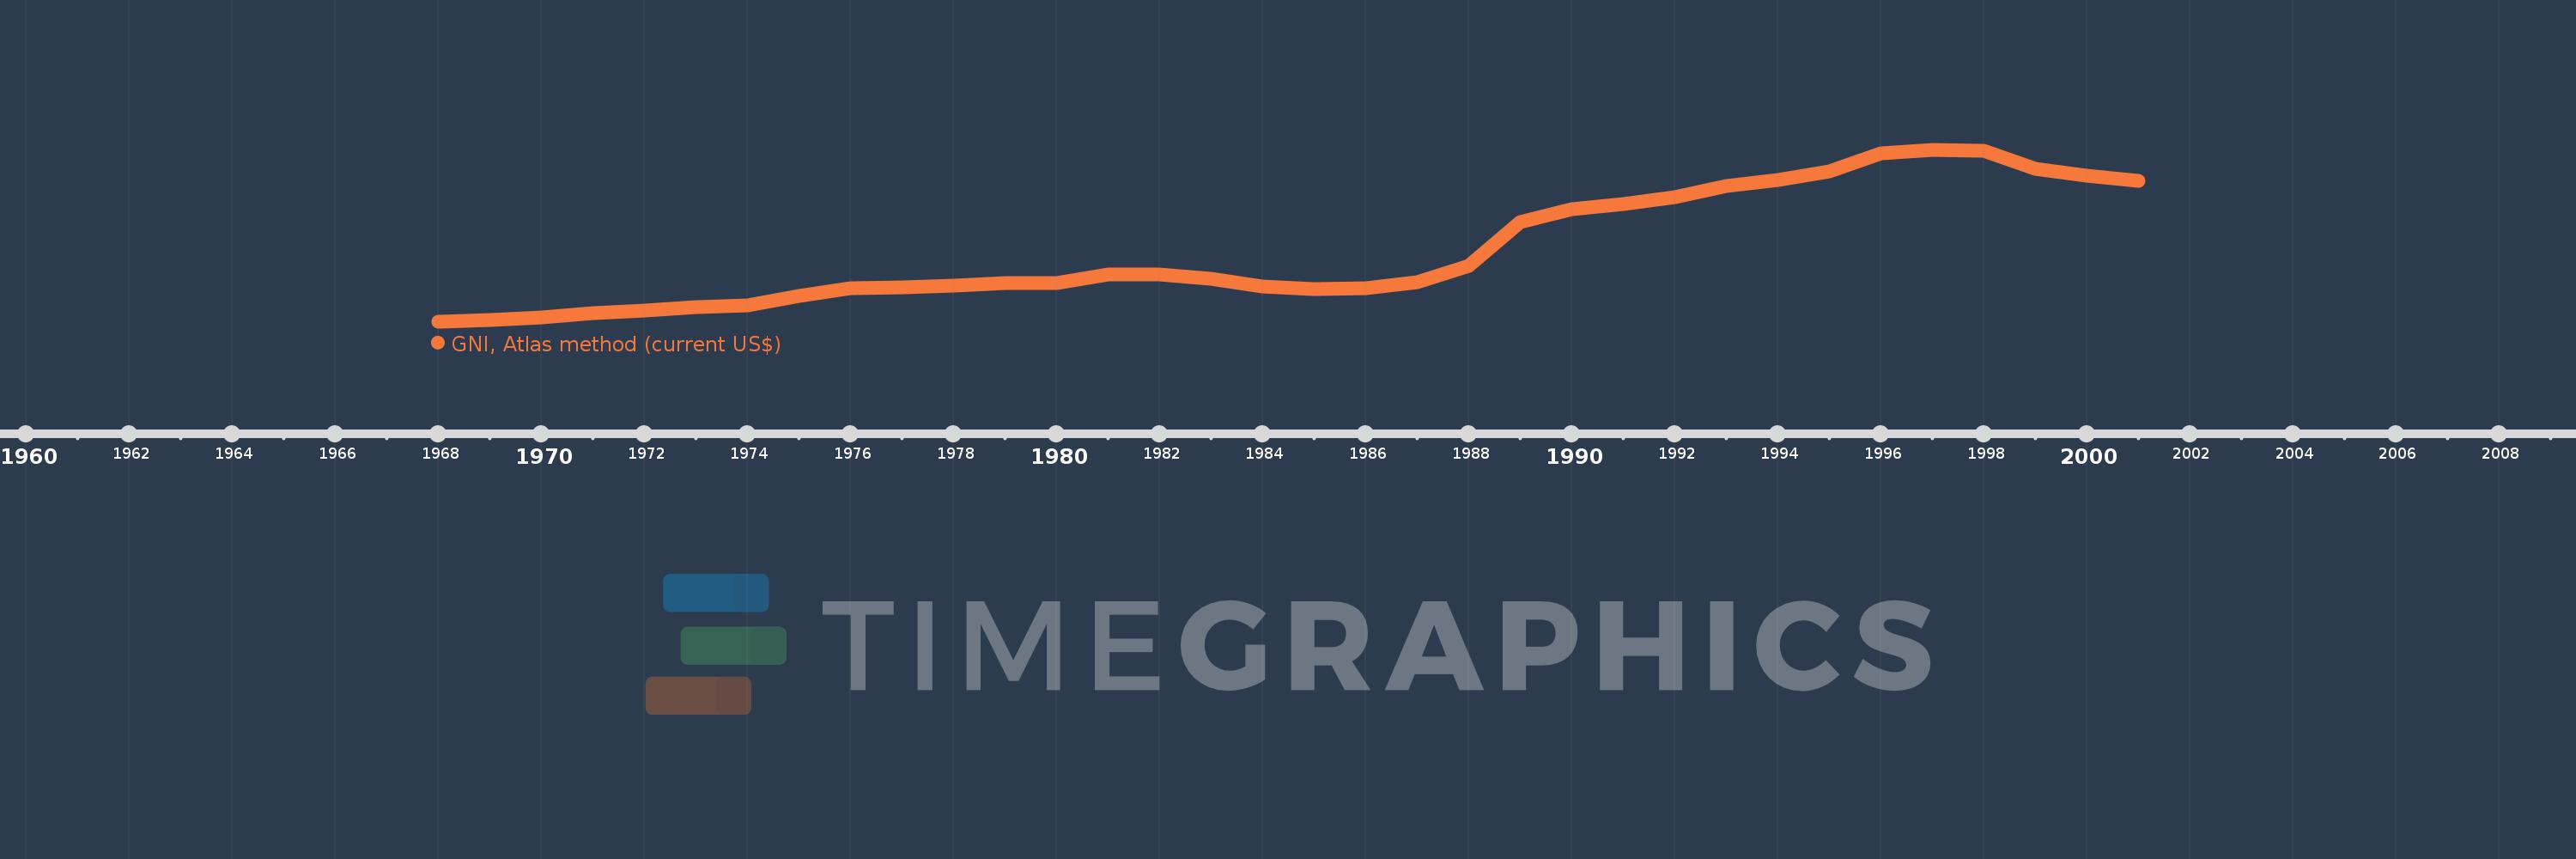
GNI, Atlas method (current US$)
2001,2000,1999,1998,1997,1996,1995,1994,1993,1992,1991,1990,1989,1988,1987,1986,1985,1984,1983,1982,1981,1980,1979,1978,1977,1976,1975,1974,1973,1972,1971,1970,1969,1968
This statistics in other country:
AfghanistanAlbaniaAlgeriaAndorraAngolaAntigua and BarbudaArab WorldArgentinaArmeniaAustraliaAustriaAzerbaijanBahamas, TheBahrainBangladeshBarbadosBelarusBelgiumBelizeBeninBermudaBhutanBoliviaBosnia and HerzegovinaBotswanaBrazilBrunei DarussalamBulgariaBurkina FasoBurundiCabo VerdeCambodiaCameroonCanadaCaribbean small statesCentral African RepublicCentral Europe and the BalticsChadChannel IslandsChileChinaColombiaComorosCongo, Dem. Rep.Congo, Rep.Costa RicaCote d'IvoireCroatiaCubaCyprusCzech RepublicDenmarkDjiboutiDominicaDominican RepublicEarly-demographic dividendEast Asia & PacificEast Asia & Pacific (excluding high income)East Asia & Pacific (IDA & IBRD countries)EcuadorEgypt, Arab Rep.El SalvadorEquatorial GuineaEritreaEstoniaEthiopiaEuro areaEurope & Central AsiaEurope & Central Asia (excluding high income)Europe & Central Asia (IDA & IBRD countries)European UnionFijiFinlandFragile and conflict affected situationsFranceFrench PolynesiaGabonGambia, TheGeorgiaGermanyGhanaGreeceGreenlandGrenadaGuatemalaGuineaGuinea-BissauGuyanaHaitiHeavily indebted poor countries (HIPC)High incomeHondurasHong Kong SAR, ChinaHungaryIBRD onlyIcelandIDA & IBRD totalIDA blendIDA onlyIDA totalIndiaIndonesiaIran, Islamic Rep.IraqIrelandIsle of ManIsraelItalyJamaicaJapanJordanKazakhstanKenyaKiribatiKorea, Rep.KosovoKuwaitKyrgyz RepublicLao PDRLate-demographic dividendLatin America & Caribbean Latin America & Caribbean (excluding high income)Latin America & the Caribbean (IDA & IBRD countries)LatviaLeast developed countries: UN classificationLebanonLesothoLiberiaLibyaLiechtensteinLithuaniaLow & middle incomeLow incomeLower middle incomeLuxembourgMacao SAR, ChinaMacedonia, FYRMadagascarMalawiMalaysiaMaldivesMaliMaltaMarshall IslandsMauritaniaMauritiusMexicoMicronesia, Fed. Sts.Middle East & North AfricaMiddle East & North Africa (excluding high income)Middle East & North Africa (IDA & IBRD countries)Middle incomeMoldovaMonacoMongoliaMontenegroMoroccoMozambiqueMyanmarNamibiaNauruNepalNetherlandsNew CaledoniaNew ZealandNicaraguaNigerNigeriaNorth AmericaNorwayOECD membersOmanOther small statesPacific island small statesPakistanPalauPanamaPapua New GuineaParaguayPeruPhilippinesPolandPortugalPost-demographic dividendPre-demographic dividendPuerto RicoQatarRomaniaRussian FederationRwandaSamoaSan MarinoSao Tome and PrincipeSaudi ArabiaSenegalSerbiaSeychellesSierra LeoneSingaporeSlovak RepublicSloveniaSmall statesSolomon IslandsSouth AfricaSouth AsiaSouth Asia (IDA & IBRD)South SudanSpainSri LankaSt. Kitts and NevisSt. LuciaSt. Vincent and the GrenadinesSub-Saharan Africa Sub-Saharan Africa (excluding high income)Sub-Saharan Africa (IDA & IBRD countries)SudanSurinameSwazilandSwedenSwitzerlandSyrian Arab RepublicTajikistanTanzaniaThailandTimor-LesteTogoTongaTrinidad and TobagoTunisiaTurkeyTurkmenistanTuvaluUgandaUkraineUnited Arab EmiratesUnited KingdomUnited StatesUpper middle incomeUruguayUzbekistanVanuatuVenezuela, RBVietnamVirgin Islands (U.S.)West Bank and GazaWorldYemen, Rep.ZambiaZimbabwe Timeline:
This timeline shows a graph from 1968 to 2001 of New Caledonia. No data until 1967. Number of actual observations by date: 34.
Source name:
World Development Indicators
Source organization:
World Bank national accounts data, and OECD National Accounts data files.
Categories, topics:
Economy & Growth
Last updated:
apr 23, 2017
Indicators value changes by year
Minimum:
176.921 mln
jan 1, 1968
Maximum:
3.604 bln
jan 1, 1997
At the date of observation
Value
Absolute change
Change from previous value
jan 1, 1968
176.921 mln
+176.921 mln
0.0%
jan 1, 1969
215.141 mln
+38.221 mln
21.6%
jan 1, 1970
262.377 mln
+47.236 mln
21.96%
jan 1, 1971
360.975 mln
+98.598 mln
37.58%
jan 1, 1972
410.311 mln
+49.336 mln
13.67%
jan 1, 1973
474.347 mln
+64.036 mln
15.61%
jan 1, 1974
512.922 mln
+38.575 mln
8.13%
jan 1, 1975
690.794 mln
+177.873 mln
34.68%
jan 1, 1976
848.497 mln
+157.703 mln
22.83%
jan 1, 1977
862.729 mln
+14.232 mln
1.68%
jan 1, 1978
894.561 mln
+31.832 mln
3.69%
jan 1, 1979
959.84 mln
+65.28 mln
7.3%
jan 1, 1980
956.27 mln
-3.57 mln
-0.37%
jan 1, 1981
1.118 bln
+161.252 mln
16.86%
jan 1, 1982
1.132 bln
+14.902 mln
1.33%
jan 1, 1983
1.043 bln
-89.524 mln
-7.91%
jan 1, 1984
879.899 mln
-163.001 mln
-15.63%
jan 1, 1985
830.563 mln
-49.337 mln
-5.61%
jan 1, 1986
850.92 mln
+20.357 mln
2.45%
jan 1, 1987
970.738 mln
+119.818 mln
14.08%
jan 1, 1988
1.295 bln
+324.568 mln
33.44%
jan 1, 1989
2.171 bln
+875.75 mln
67.61%
jan 1, 1990
2.426 bln
+254.803 mln
11.74%
jan 1, 1991
2.522 bln
+95.952 mln
3.96%
jan 1, 1992
2.665 bln
+143.154 mln
5.68%
jan 1, 1993
2.889 bln
+224.438 mln
8.42%
jan 1, 1994
3.015 bln
+125.517 mln
4.34%
jan 1, 1995
3.18 bln
+165.398 mln
5.49%
jan 1, 1996
3.532 bln
+351.856 mln
11.06%
jan 1, 1997
3.604 bln
+71.422 mln
2.02%
jan 1, 1998
3.587 bln
-17.014 mln
-0.47%
jan 1, 1999
3.228 bln
-358.193 mln
-9.99%
jan 1, 2000
3.098 bln
-130.215 mln
-4.03%
jan 1, 2001
2.989 bln
-108.83 mln
-3.51%
Ranking of countries by current statistics by years


Comments: