29
/
en
AIzaSyAYiBZKx7MnpbEhh9jyipgxe19OcubqV5w
April 1, 2024
69685
Argentina
ARG
true
2
1
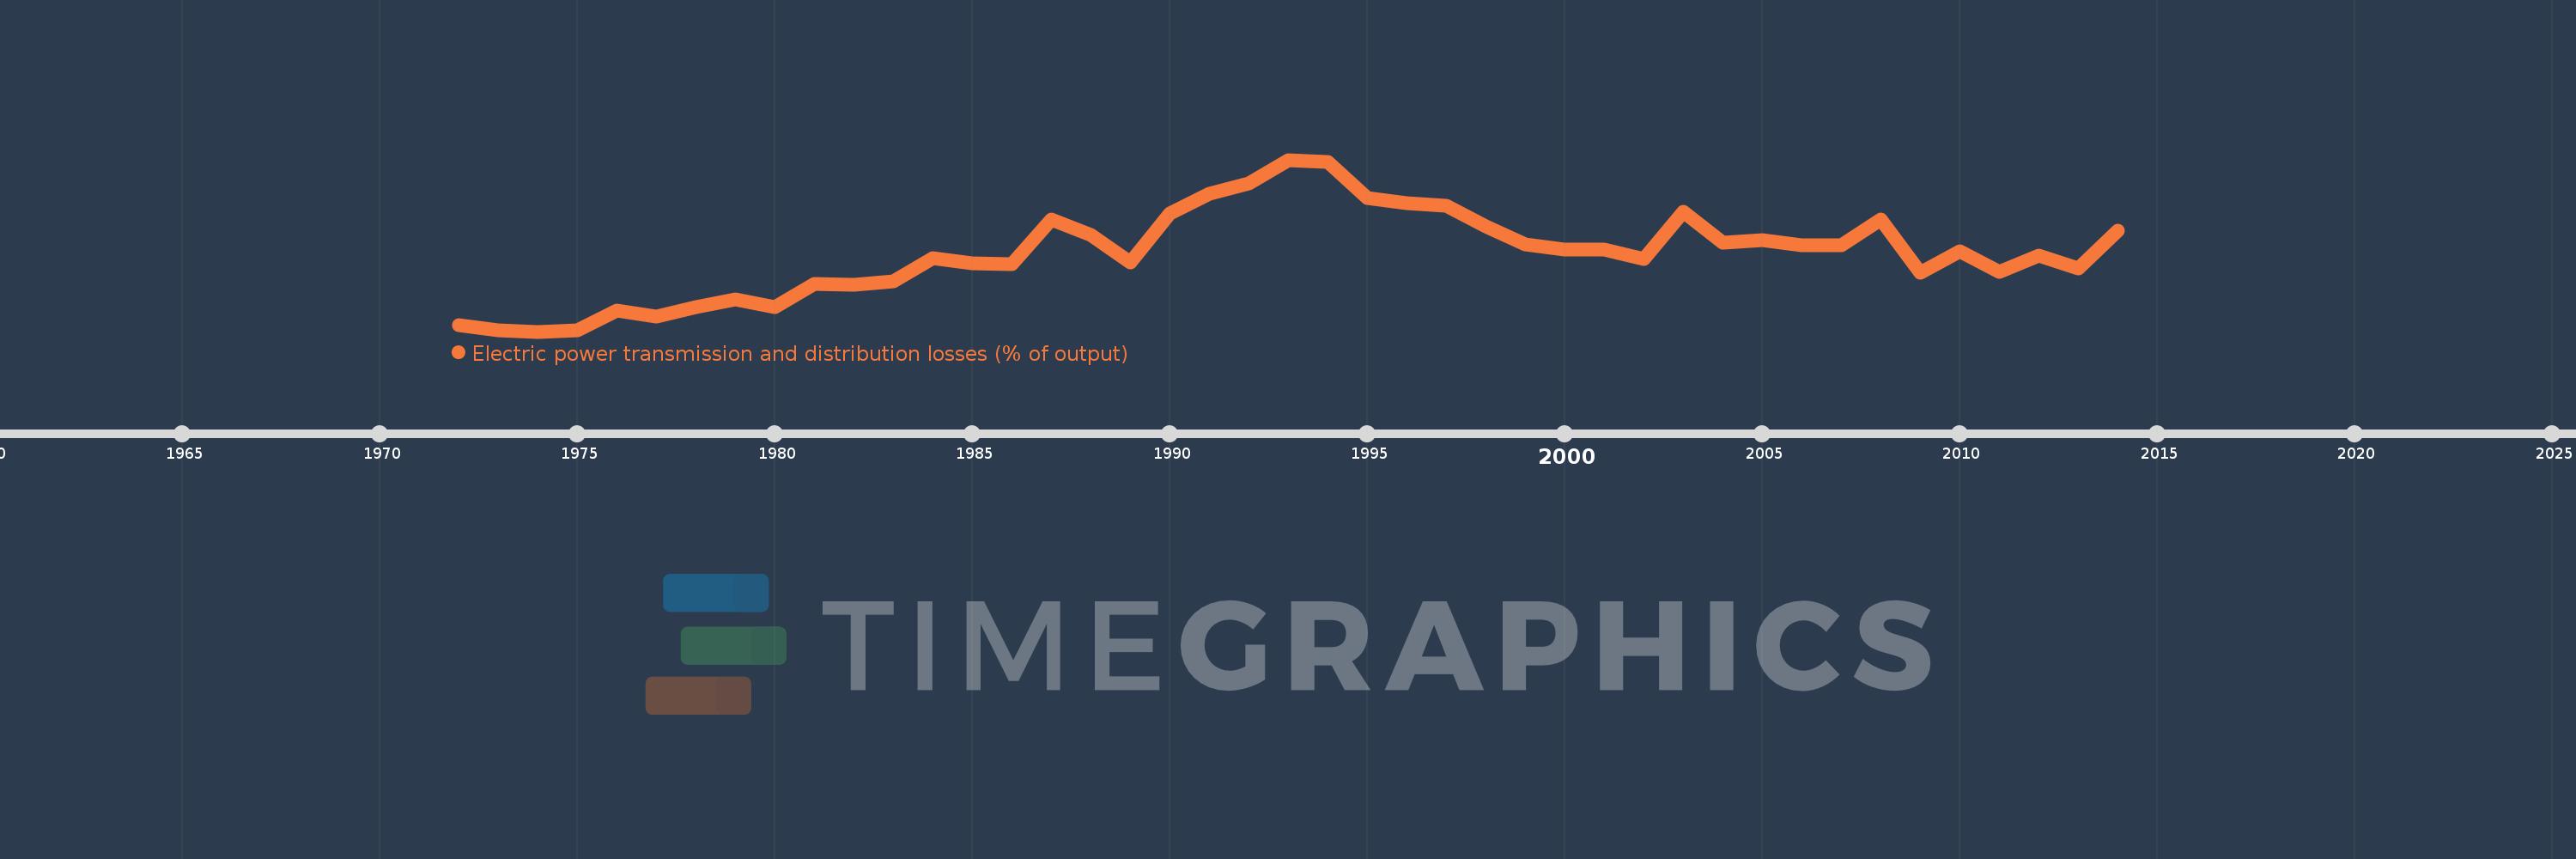
Electric power transmission and distribution losses (% of output)
2014,2013,2012,2011,2010,2009,2008,2007,2006,2005,2004,2003,2002,2001,2000,1999,1998,1997,1996,1995,1994,1993,1992,1991,1990,1989,1988,1987,1986,1985,1984,1983,1982,1981,1980,1979,1978,1977,1976,1975,1974,1973,1972
This statistics in other country:
AlbaniaAlgeriaAngolaArab WorldArgentinaArmeniaAustraliaAustriaAzerbaijanBahrainBangladeshBelarusBelgiumBeninBoliviaBosnia and HerzegovinaBotswanaBrazilBrunei DarussalamBulgariaCambodiaCameroonCanadaCaribbean small statesCentral Europe and the BalticsChileChinaColombiaCongo, Dem. Rep.Congo, Rep.Costa RicaCote d'IvoireCroatiaCubaCuracaoCyprusCzech RepublicDenmarkDominican RepublicEarly-demographic dividendEast Asia & PacificEast Asia & Pacific (excluding high income)East Asia & Pacific (IDA & IBRD countries)EcuadorEgypt, Arab Rep.El SalvadorEritreaEstoniaEthiopiaEuro areaEurope & Central AsiaEurope & Central Asia (excluding high income)Europe & Central Asia (IDA & IBRD countries)European UnionFinlandFragile and conflict affected situationsFranceGabonGeorgiaGermanyGhanaGibraltarGreeceGuatemalaHaitiHeavily indebted poor countries (HIPC)High incomeHondurasHong Kong SAR, ChinaHungaryIBRD onlyIcelandIDA & IBRD totalIDA blendIDA onlyIDA totalIndiaIndonesiaIran, Islamic Rep.IraqIrelandIsraelItalyJamaicaJapanJordanKazakhstanKenyaKorea, Dem. People’s Rep.Korea, Rep.KosovoKuwaitKyrgyz RepublicLate-demographic dividendLatin America & Caribbean Latin America & Caribbean (excluding high income)Latin America & the Caribbean (IDA & IBRD countries)LatviaLeast developed countries: UN classificationLebanonLibyaLithuaniaLow & middle incomeLow incomeLower middle incomeLuxembourgMacedonia, FYRMalaysiaMaltaMauritiusMexicoMiddle East & North AfricaMiddle East & North Africa (excluding high income)Middle East & North Africa (IDA & IBRD countries)Middle incomeMoldovaMongoliaMontenegroMoroccoMozambiqueMyanmarNamibiaNepalNetherlandsNew ZealandNicaraguaNigerNigeriaNorth AmericaNorwayOECD membersOmanOther small statesPakistanPanamaParaguayPeruPhilippinesPolandPortugalPost-demographic dividendPre-demographic dividendQatarRomaniaRussian FederationSaudi ArabiaSenegalSerbiaSingaporeSlovak RepublicSloveniaSmall statesSouth AfricaSouth AsiaSouth Asia (IDA & IBRD)South SudanSpainSri LankaSub-Saharan Africa Sub-Saharan Africa (excluding high income)Sub-Saharan Africa (IDA & IBRD countries)SudanSwedenSwitzerlandSyrian Arab RepublicTajikistanTanzaniaThailandTogoTrinidad and TobagoTunisiaTurkeyTurkmenistanUkraineUnited Arab EmiratesUnited KingdomUnited StatesUpper middle incomeUruguayUzbekistanVenezuela, RBVietnamWorldYemen, Rep.ZambiaZimbabwe Timeline:
This timeline shows a graph from 1972 to 2014 of Argentina. No data until 1971. Number of actual observations by date: 43.
Source name:
World Development Indicators
Source organization:
IEA Statistics © OECD/IEA 2014 (http://www.iea.org/stats/index.asp), subject to https://www.iea.org/t&c/termsandconditions/
Categories, topics:
Energy & Mining, Infrastructure
Last updated:
apr 23, 2017
Indicators value changes by year
Maximum:
20.395
jan 1, 1993
At the date of observation
Value
Absolute change
Change from previous value
jan 1, 1972
10.159
+10.159
0.0%
jan 1, 1973
9.832
-0.327
-3.22%
jan 1, 1974
9.752
-0.08
-0.81%
jan 1, 1975
9.818
+0.065
0.67%
jan 1, 1976
11.055
+1.238
12.61%
jan 1, 1977
10.7
-0.356
-3.22%
jan 1, 1978
11.264
+0.564
5.27%
jan 1, 1979
11.722
+0.458
4.06%
jan 1, 1980
11.275
-0.447
-3.81%
jan 1, 1981
12.681
+1.406
12.47%
jan 1, 1982
12.663
-0.018
-0.14%
jan 1, 1983
12.857
+0.194
1.53%
jan 1, 1984
14.304
+1.447
11.25%
jan 1, 1985
13.964
-0.34
-2.38%
jan 1, 1986
13.949
-0.015
-0.11%
jan 1, 1987
16.685
+2.736
19.61%
jan 1, 1988
15.755
-0.929
-5.57%
jan 1, 1989
14.024
-1.731
-10.99%
jan 1, 1990
17.083
+3.059
21.82%
jan 1, 1991
18.313
+1.23
7.2%
jan 1, 1992
18.934
+0.621
3.39%
jan 1, 1993
20.395
+1.461
7.72%
jan 1, 1994
20.266
-0.129
-0.63%
jan 1, 1995
18.009
-2.257
-11.14%
jan 1, 1996
17.702
-0.307
-1.7%
jan 1, 1997
17.524
-0.178
-1.0%
jan 1, 1998
16.263
-1.261
-7.2%
jan 1, 1999
15.164
-1.099
-6.76%
jan 1, 2000
14.828
-0.335
-2.21%
jan 1, 2001
14.833
+0.005
0.03%
jan 1, 2002
14.256
-0.577
-3.89%
jan 1, 2003
17.17
+2.914
20.44%
jan 1, 2004
15.266
-1.905
-11.09%
jan 1, 2005
15.42
+0.154
1.01%
jan 1, 2006
15.125
-0.294
-1.91%
jan 1, 2007
15.118
-0.008
-0.05%
jan 1, 2008
16.718
+1.6
10.59%
jan 1, 2009
13.383
-3.335
-19.95%
jan 1, 2010
14.747
+1.365
10.2%
jan 1, 2011
13.425
-1.322
-8.97%
jan 1, 2012
14.435
+1.009
7.52%
jan 1, 2013
13.686
-0.749
-5.19%
jan 1, 2014
16.008
+2.322
16.97%
Ranking of countries by current statistics by years


Comments: