29
/
en
AIzaSyAYiBZKx7MnpbEhh9jyipgxe19OcubqV5w
April 1, 2024
130337
Ethiopia
ETH
true
2
1
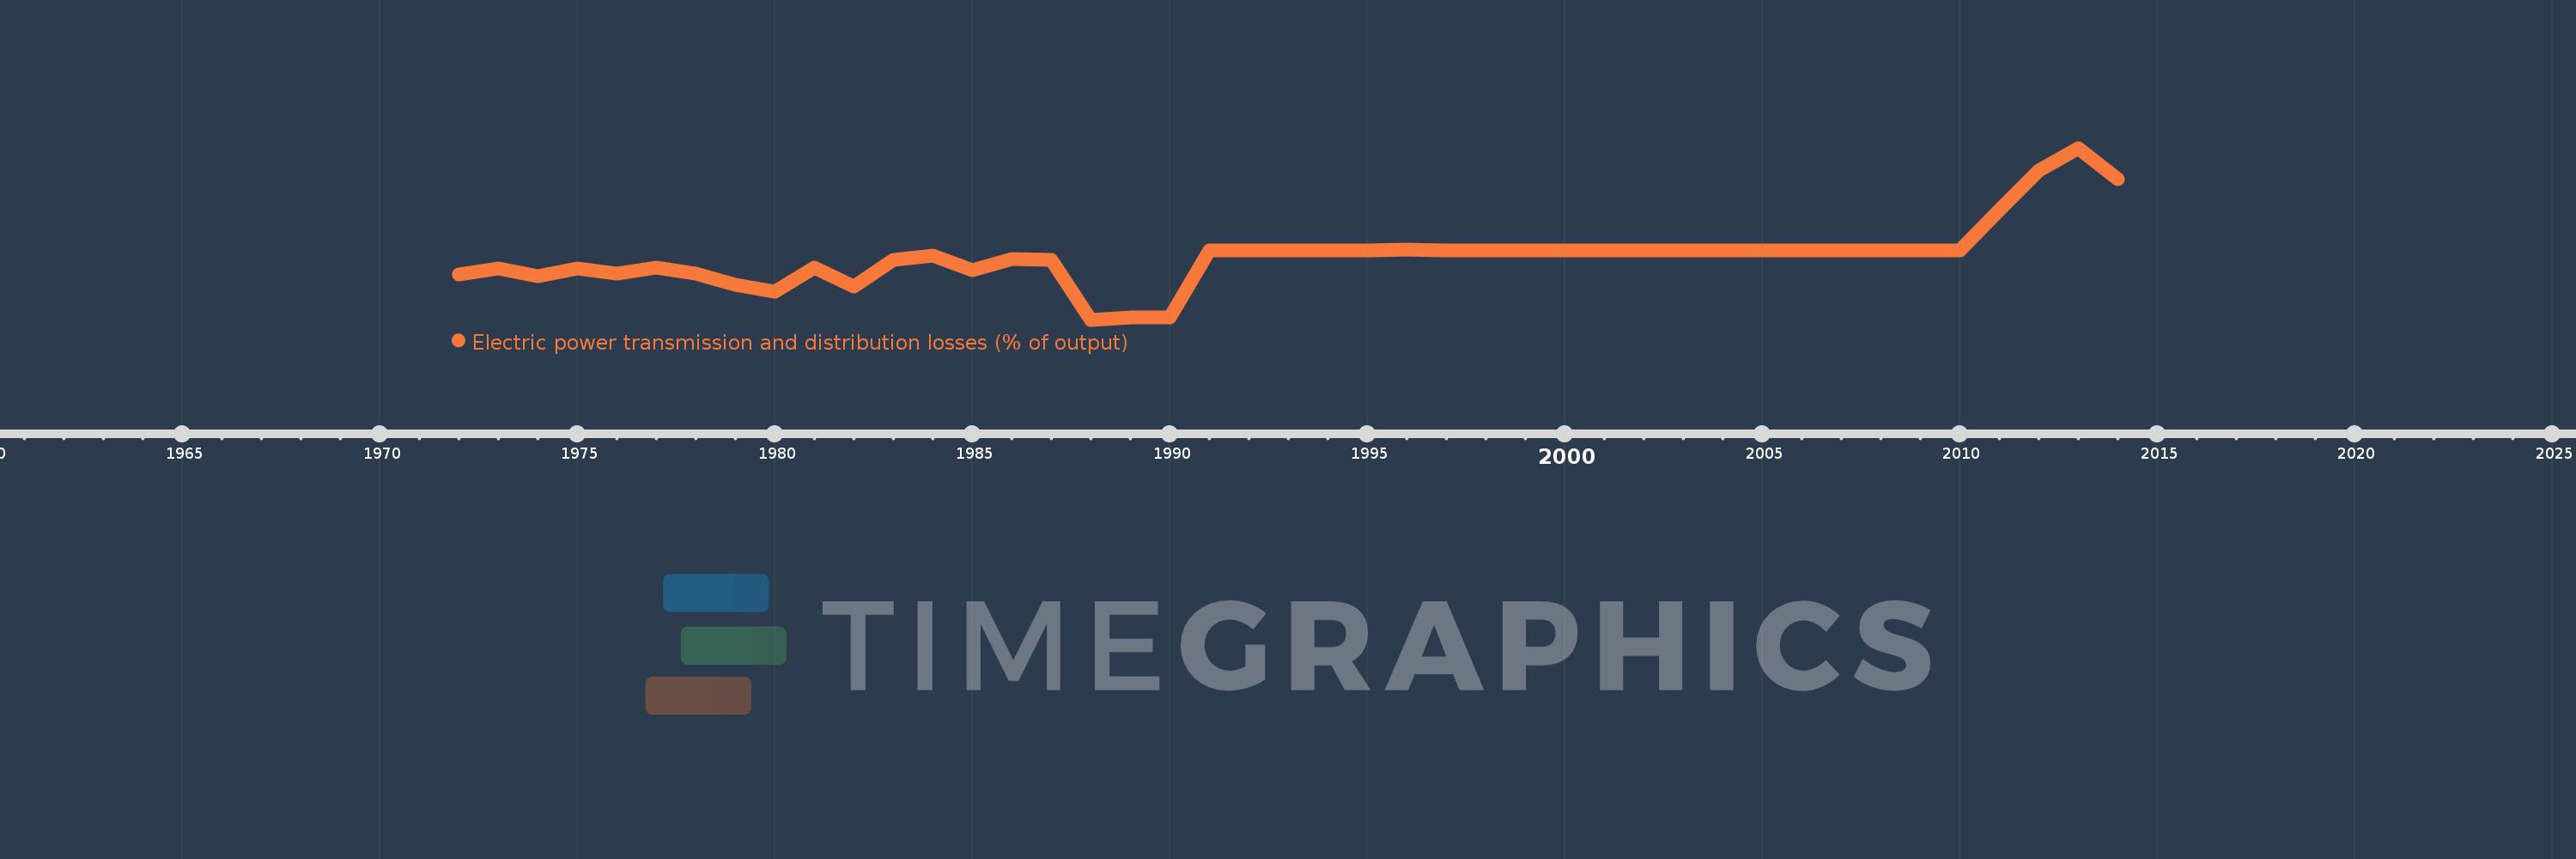
Electric power transmission and distribution losses (% of output)
2014,2013,2012,2011,2010,2009,2008,2007,2006,2005,2004,2003,2002,2001,2000,1999,1998,1997,1996,1995,1994,1993,1992,1991,1990,1989,1988,1987,1986,1985,1984,1983,1982,1981,1980,1979,1978,1977,1976,1975,1974,1973,1972
This statistics in other country:
AlbaniaAlgeriaAngolaArab WorldArgentinaArmeniaAustraliaAustriaAzerbaijanBahrainBangladeshBelarusBelgiumBeninBoliviaBosnia and HerzegovinaBotswanaBrazilBrunei DarussalamBulgariaCambodiaCameroonCanadaCaribbean small statesCentral Europe and the BalticsChileChinaColombiaCongo, Dem. Rep.Congo, Rep.Costa RicaCote d'IvoireCroatiaCubaCuracaoCyprusCzech RepublicDenmarkDominican RepublicEarly-demographic dividendEast Asia & PacificEast Asia & Pacific (excluding high income)East Asia & Pacific (IDA & IBRD countries)EcuadorEgypt, Arab Rep.El SalvadorEritreaEstoniaEthiopiaEuro areaEurope & Central AsiaEurope & Central Asia (excluding high income)Europe & Central Asia (IDA & IBRD countries)European UnionFinlandFragile and conflict affected situationsFranceGabonGeorgiaGermanyGhanaGibraltarGreeceGuatemalaHaitiHeavily indebted poor countries (HIPC)High incomeHondurasHong Kong SAR, ChinaHungaryIBRD onlyIcelandIDA & IBRD totalIDA blendIDA onlyIDA totalIndiaIndonesiaIran, Islamic Rep.IraqIrelandIsraelItalyJamaicaJapanJordanKazakhstanKenyaKorea, Dem. People’s Rep.Korea, Rep.KosovoKuwaitKyrgyz RepublicLate-demographic dividendLatin America & Caribbean Latin America & Caribbean (excluding high income)Latin America & the Caribbean (IDA & IBRD countries)LatviaLeast developed countries: UN classificationLebanonLibyaLithuaniaLow & middle incomeLow incomeLower middle incomeLuxembourgMacedonia, FYRMalaysiaMaltaMauritiusMexicoMiddle East & North AfricaMiddle East & North Africa (excluding high income)Middle East & North Africa (IDA & IBRD countries)Middle incomeMoldovaMongoliaMontenegroMoroccoMozambiqueMyanmarNamibiaNepalNetherlandsNew ZealandNicaraguaNigerNigeriaNorth AmericaNorwayOECD membersOmanOther small statesPakistanPanamaParaguayPeruPhilippinesPolandPortugalPost-demographic dividendPre-demographic dividendQatarRomaniaRussian FederationSaudi ArabiaSenegalSerbiaSingaporeSlovak RepublicSloveniaSmall statesSouth AfricaSouth AsiaSouth Asia (IDA & IBRD)South SudanSpainSri LankaSub-Saharan Africa Sub-Saharan Africa (excluding high income)Sub-Saharan Africa (IDA & IBRD countries)SudanSwedenSwitzerlandSyrian Arab RepublicTajikistanTanzaniaThailandTogoTrinidad and TobagoTunisiaTurkeyTurkmenistanUkraineUnited Arab EmiratesUnited KingdomUnited StatesUpper middle incomeUruguayUzbekistanVenezuela, RBVietnamWorldYemen, Rep.ZambiaZimbabwe Timeline:
This timeline shows a graph from 1972 to 2014 of Ethiopia. No data until 1971. Number of actual observations by date: 43.
Source name:
World Development Indicators
Source organization:
IEA Statistics © OECD/IEA 2014 (http://www.iea.org/stats/index.asp), subject to https://www.iea.org/t&c/termsandconditions/
Categories, topics:
Energy & Mining, Infrastructure
Last updated:
apr 23, 2017
Indicators value changes by year
Maximum:
22.871
jan 1, 2013
At the date of observation
Value
Absolute change
Change from previous value
jan 1, 1972
6.914
+6.914
0.0%
jan 1, 1973
7.692
+0.778
11.26%
jan 1, 1974
6.768
-0.924
-12.01%
jan 1, 1975
7.666
+0.898
13.27%
jan 1, 1976
7.093
-0.573
-7.47%
jan 1, 1977
7.813
+0.719
10.14%
jan 1, 1978
6.998
-0.814
-10.42%
jan 1, 1979
5.644
-1.354
-19.35%
jan 1, 1980
4.792
-0.851
-15.09%
jan 1, 1981
7.837
+3.045
63.54%
jan 1, 1982
5.409
-2.428
-30.98%
jan 1, 1983
8.772
+3.363
62.17%
jan 1, 1984
9.302
+0.53
6.05%
jan 1, 1985
7.473
-1.83
-19.67%
jan 1, 1986
8.896
+1.424
19.05%
jan 1, 1987
8.743
-0.153
-1.72%
jan 1, 1988
1.233
-7.51
-85.9%
jan 1, 1989
1.482
+0.249
20.2%
jan 1, 1990
1.479
-0.003
-0.23%
jan 1, 1991
9.983
+8.504
575.03%
jan 1, 1992
10.008
+0.025
0.25%
jan 1, 1993
9.992
-0.016
-0.16%
jan 1, 1994
9.978
-0.014
-0.14%
jan 1, 1995
9.993
+0.015
0.15%
jan 1, 1996
10.02
+0.027
0.27%
jan 1, 1997
9.981
-0.038
-0.38%
jan 1, 1998
9.975
-0.006
-0.06%
jan 1, 1999
9.982
+0.007
0.07%
jan 1, 2000
9.976
-0.006
-0.06%
jan 1, 2001
9.976
+0.0
0.0%
jan 1, 2002
9.99
+0.014
0.14%
jan 1, 2003
9.98
-0.01
-0.1%
jan 1, 2004
10.017
+0.037
0.37%
jan 1, 2005
10.004
-0.013
-0.13%
jan 1, 2006
10.018
+0.014
0.14%
jan 1, 2007
10.003
-0.015
-0.14%
jan 1, 2008
10.008
+0.005
0.05%
jan 1, 2009
10.008
-0.001
-0.01%
jan 1, 2010
9.995
-0.013
-0.13%
jan 1, 2011
15.0
+5.005
50.08%
jan 1, 2012
19.997
+4.997
33.31%
jan 1, 2013
22.871
+2.874
14.37%
jan 1, 2014
18.982
-3.889
-17.0%
Ranking of countries by current statistics by years


Comments: