29
/
en
AIzaSyAYiBZKx7MnpbEhh9jyipgxe19OcubqV5w
April 1, 2024
88435
Bosnia and Herzegovina
BIH
true
2
1
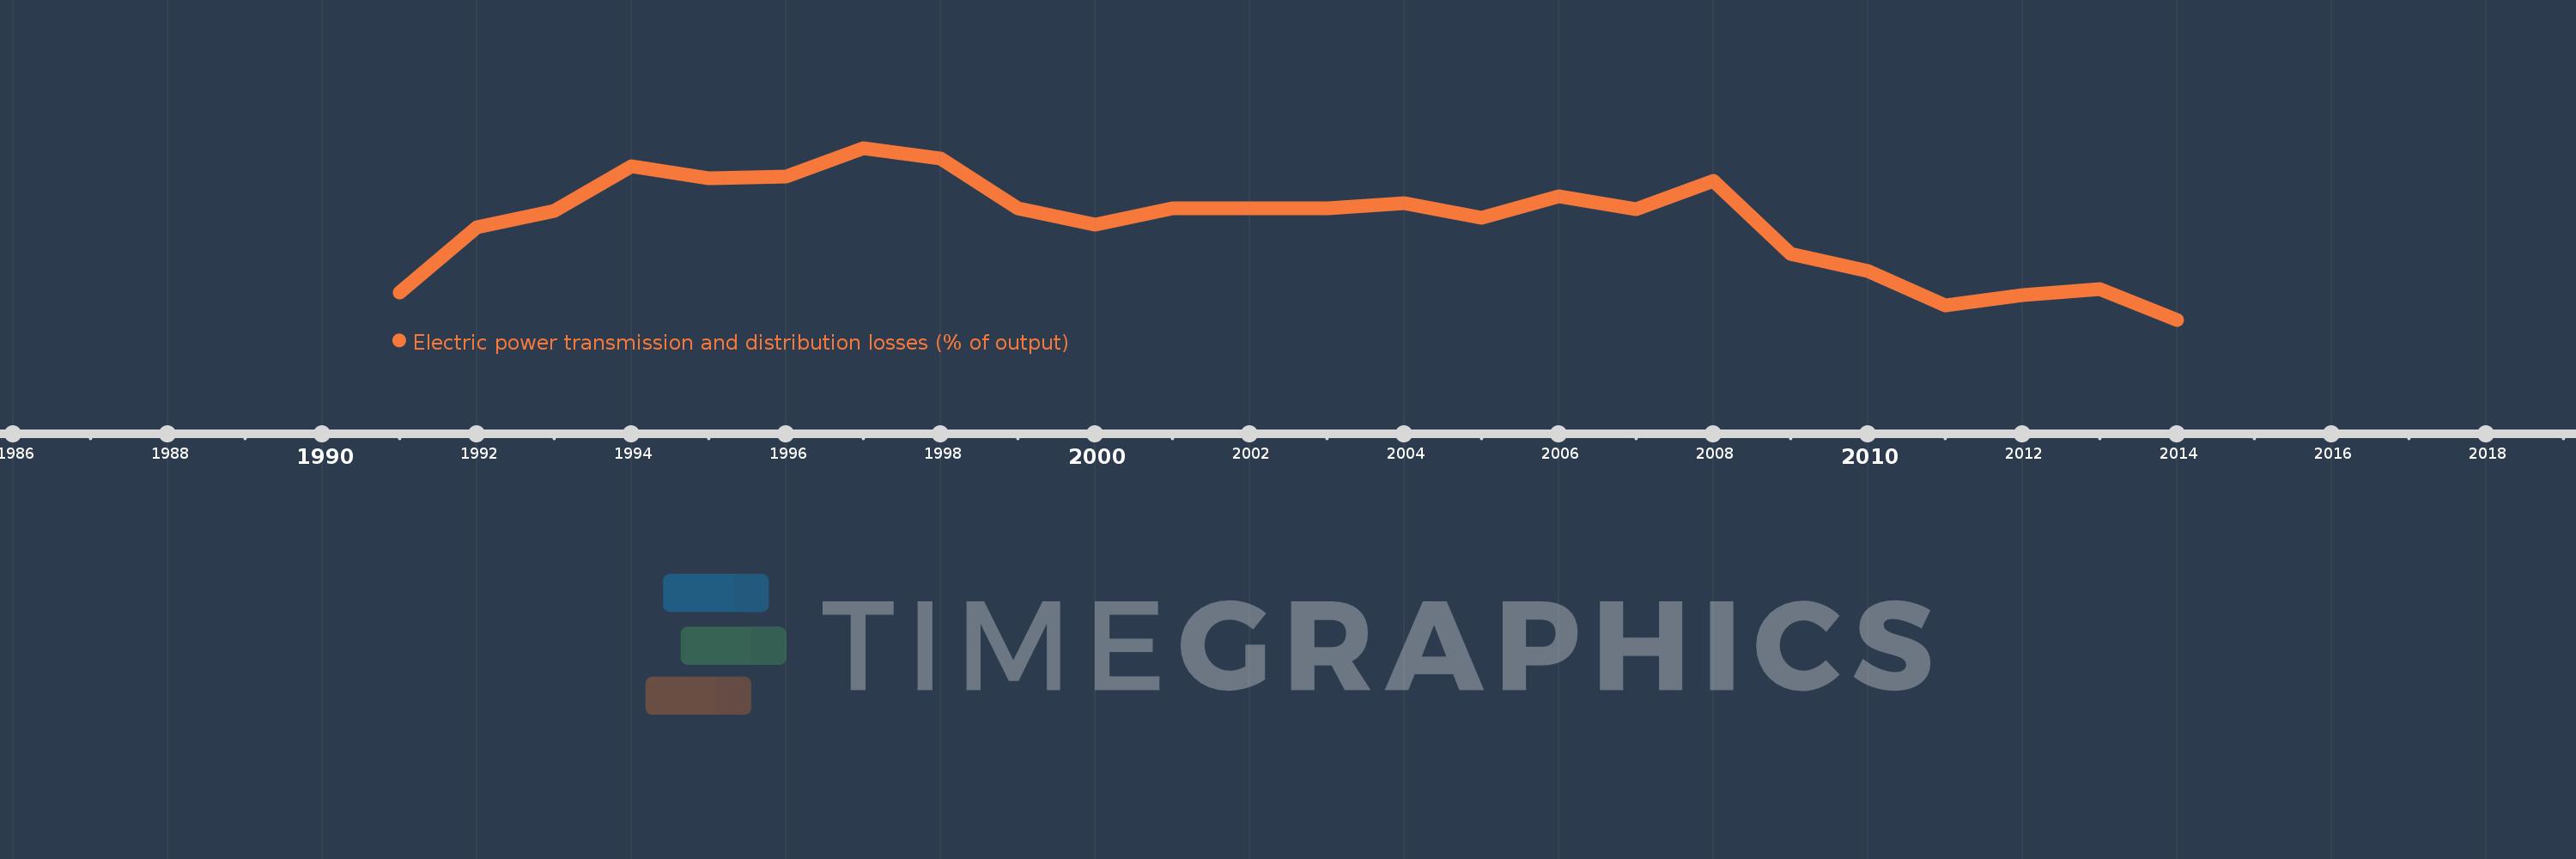
Electric power transmission and distribution losses (% of output)
2014,2013,2012,2011,2010,2009,2008,2007,2006,2005,2004,2003,2002,2001,2000,1999,1998,1997,1996,1995,1994,1993,1992,1991
This statistics in other country:
AlbaniaAlgeriaAngolaArab WorldArgentinaArmeniaAustraliaAustriaAzerbaijanBahrainBangladeshBelarusBelgiumBeninBoliviaBosnia and HerzegovinaBotswanaBrazilBrunei DarussalamBulgariaCambodiaCameroonCanadaCaribbean small statesCentral Europe and the BalticsChileChinaColombiaCongo, Dem. Rep.Congo, Rep.Costa RicaCote d'IvoireCroatiaCubaCuracaoCyprusCzech RepublicDenmarkDominican RepublicEarly-demographic dividendEast Asia & PacificEast Asia & Pacific (excluding high income)East Asia & Pacific (IDA & IBRD countries)EcuadorEgypt, Arab Rep.El SalvadorEritreaEstoniaEthiopiaEuro areaEurope & Central AsiaEurope & Central Asia (excluding high income)Europe & Central Asia (IDA & IBRD countries)European UnionFinlandFragile and conflict affected situationsFranceGabonGeorgiaGermanyGhanaGibraltarGreeceGuatemalaHaitiHeavily indebted poor countries (HIPC)High incomeHondurasHong Kong SAR, ChinaHungaryIBRD onlyIcelandIDA & IBRD totalIDA blendIDA onlyIDA totalIndiaIndonesiaIran, Islamic Rep.IraqIrelandIsraelItalyJamaicaJapanJordanKazakhstanKenyaKorea, Dem. People’s Rep.Korea, Rep.KosovoKuwaitKyrgyz RepublicLate-demographic dividendLatin America & Caribbean Latin America & Caribbean (excluding high income)Latin America & the Caribbean (IDA & IBRD countries)LatviaLeast developed countries: UN classificationLebanonLibyaLithuaniaLow & middle incomeLow incomeLower middle incomeLuxembourgMacedonia, FYRMalaysiaMaltaMauritiusMexicoMiddle East & North AfricaMiddle East & North Africa (excluding high income)Middle East & North Africa (IDA & IBRD countries)Middle incomeMoldovaMongoliaMontenegroMoroccoMozambiqueMyanmarNamibiaNepalNetherlandsNew ZealandNicaraguaNigerNigeriaNorth AmericaNorwayOECD membersOmanOther small statesPakistanPanamaParaguayPeruPhilippinesPolandPortugalPost-demographic dividendPre-demographic dividendQatarRomaniaRussian FederationSaudi ArabiaSenegalSerbiaSingaporeSlovak RepublicSloveniaSmall statesSouth AfricaSouth AsiaSouth Asia (IDA & IBRD)South SudanSpainSri LankaSub-Saharan Africa Sub-Saharan Africa (excluding high income)Sub-Saharan Africa (IDA & IBRD countries)SudanSwedenSwitzerlandSyrian Arab RepublicTajikistanTanzaniaThailandTogoTrinidad and TobagoTunisiaTurkeyTurkmenistanUkraineUnited Arab EmiratesUnited KingdomUnited StatesUpper middle incomeUruguayUzbekistanVenezuela, RBVietnamWorldYemen, Rep.ZambiaZimbabwe Timeline:
This timeline shows a graph from 1991 to 2014 of Bosnia and Herzegovina. No data until 1990. Number of actual observations by date: 24.
Source name:
World Development Indicators
Source organization:
IEA Statistics © OECD/IEA 2014 (http://www.iea.org/stats/index.asp), subject to https://www.iea.org/t&c/termsandconditions/
Categories, topics:
Energy & Mining, Infrastructure
Last updated:
apr 23, 2017
Indicators value changes by year
Maximum:
21.322
jan 1, 1997
At the date of observation
Value
Absolute change
Change from previous value
jan 1, 1991
10.388
+10.388
0.0%
jan 1, 1992
15.328
+4.94
47.55%
jan 1, 1993
16.552
+1.223
7.98%
jan 1, 1994
19.928
+3.376
20.4%
jan 1, 1995
19.039
-0.889
-4.46%
jan 1, 1996
19.155
+0.116
0.61%
jan 1, 1997
21.322
+2.167
11.31%
jan 1, 1998
20.548
-0.774
-3.63%
jan 1, 1999
16.768
-3.78
-18.4%
jan 1, 2000
15.531
-1.237
-7.38%
jan 1, 2001
16.771
+1.24
7.98%
jan 1, 2002
16.742
-0.029
-0.17%
jan 1, 2003
16.745
+0.004
0.02%
jan 1, 2004
17.131
+0.386
2.3%
jan 1, 2005
16.051
-1.08
-6.3%
jan 1, 2006
17.672
+1.621
10.1%
jan 1, 2007
16.695
-0.976
-5.52%
jan 1, 2008
18.822
+2.127
12.74%
jan 1, 2009
13.263
-5.559
-29.53%
jan 1, 2010
11.967
-1.296
-9.77%
jan 1, 2011
9.355
-2.612
-21.82%
jan 1, 2012
10.137
+0.782
8.36%
jan 1, 2013
10.623
+0.486
4.79%
jan 1, 2014
8.298
-2.326
-21.89%
Ranking of countries by current statistics by years


Comments: