29
/
en
AIzaSyAYiBZKx7MnpbEhh9jyipgxe19OcubqV5w
April 1, 2024
112121
Costa Rica
CRI
true
2
1
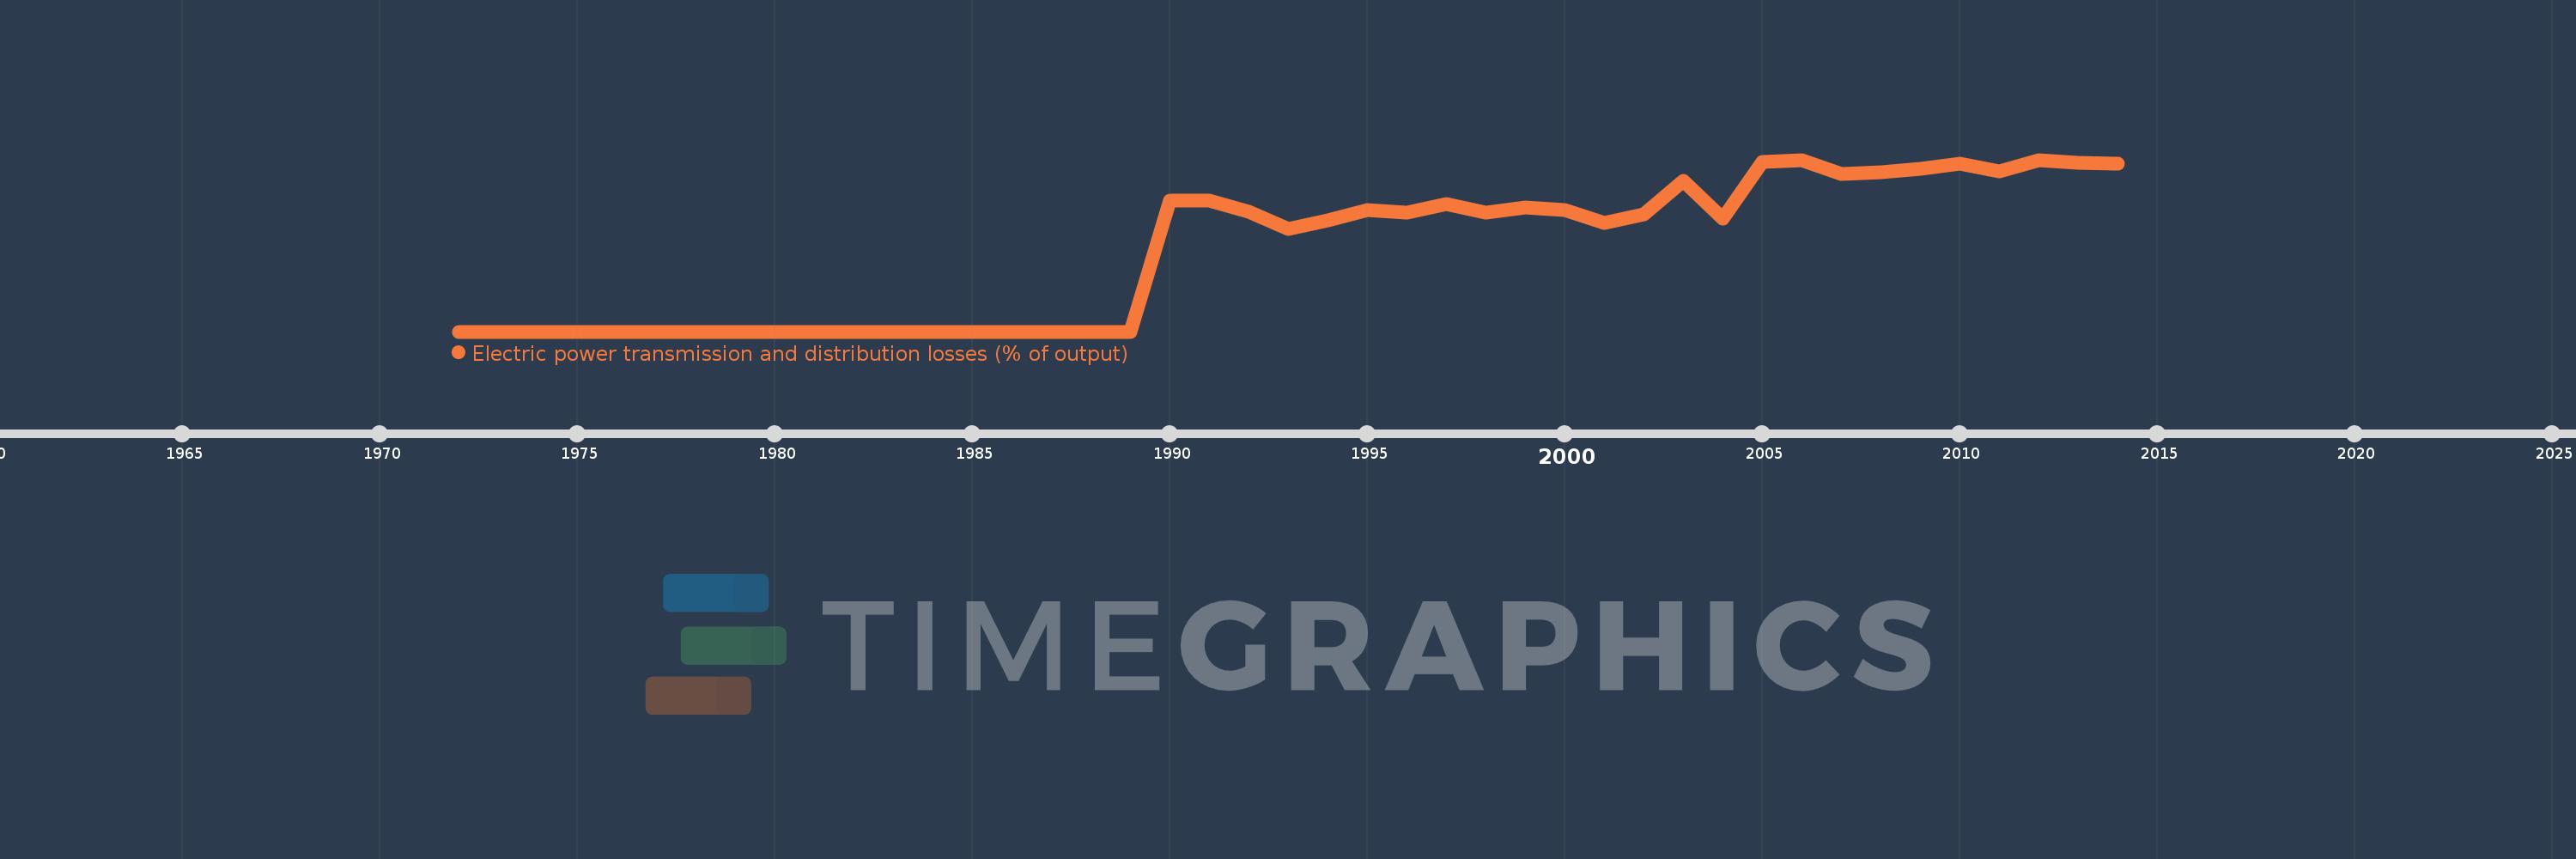
Electric power transmission and distribution losses (% of output)
2014,2013,2012,2011,2010,2009,2008,2007,2006,2005,2004,2003,2002,2001,2000,1999,1998,1997,1996,1995,1994,1993,1992,1991,1990,1989,1988,1987,1986,1985,1984,1983,1982,1981,1980,1979,1978,1977,1976,1975,1974,1973,1972
This statistics in other country:
AlbaniaAlgeriaAngolaArab WorldArgentinaArmeniaAustraliaAustriaAzerbaijanBahrainBangladeshBelarusBelgiumBeninBoliviaBosnia and HerzegovinaBotswanaBrazilBrunei DarussalamBulgariaCambodiaCameroonCanadaCaribbean small statesCentral Europe and the BalticsChileChinaColombiaCongo, Dem. Rep.Congo, Rep.Costa RicaCote d'IvoireCroatiaCubaCuracaoCyprusCzech RepublicDenmarkDominican RepublicEarly-demographic dividendEast Asia & PacificEast Asia & Pacific (excluding high income)East Asia & Pacific (IDA & IBRD countries)EcuadorEgypt, Arab Rep.El SalvadorEritreaEstoniaEthiopiaEuro areaEurope & Central AsiaEurope & Central Asia (excluding high income)Europe & Central Asia (IDA & IBRD countries)European UnionFinlandFragile and conflict affected situationsFranceGabonGeorgiaGermanyGhanaGibraltarGreeceGuatemalaHaitiHeavily indebted poor countries (HIPC)High incomeHondurasHong Kong SAR, ChinaHungaryIBRD onlyIcelandIDA & IBRD totalIDA blendIDA onlyIDA totalIndiaIndonesiaIran, Islamic Rep.IraqIrelandIsraelItalyJamaicaJapanJordanKazakhstanKenyaKorea, Dem. People’s Rep.Korea, Rep.KosovoKuwaitKyrgyz RepublicLate-demographic dividendLatin America & Caribbean Latin America & Caribbean (excluding high income)Latin America & the Caribbean (IDA & IBRD countries)LatviaLeast developed countries: UN classificationLebanonLibyaLithuaniaLow & middle incomeLow incomeLower middle incomeLuxembourgMacedonia, FYRMalaysiaMaltaMauritiusMexicoMiddle East & North AfricaMiddle East & North Africa (excluding high income)Middle East & North Africa (IDA & IBRD countries)Middle incomeMoldovaMongoliaMontenegroMoroccoMozambiqueMyanmarNamibiaNepalNetherlandsNew ZealandNicaraguaNigerNigeriaNorth AmericaNorwayOECD membersOmanOther small statesPakistanPanamaParaguayPeruPhilippinesPolandPortugalPost-demographic dividendPre-demographic dividendQatarRomaniaRussian FederationSaudi ArabiaSenegalSerbiaSingaporeSlovak RepublicSloveniaSmall statesSouth AfricaSouth AsiaSouth Asia (IDA & IBRD)South SudanSpainSri LankaSub-Saharan Africa Sub-Saharan Africa (excluding high income)Sub-Saharan Africa (IDA & IBRD countries)SudanSwedenSwitzerlandSyrian Arab RepublicTajikistanTanzaniaThailandTogoTrinidad and TobagoTunisiaTurkeyTurkmenistanUkraineUnited Arab EmiratesUnited KingdomUnited StatesUpper middle incomeUruguayUzbekistanVenezuela, RBVietnamWorldYemen, Rep.ZambiaZimbabwe Timeline:
This timeline shows a graph from 1972 to 2014 of Costa Rica. No data until 1971. Number of actual observations by date: 43.
Source name:
World Development Indicators
Source organization:
IEA Statistics © OECD/IEA 2014 (http://www.iea.org/stats/index.asp), subject to https://www.iea.org/t&c/termsandconditions/
Categories, topics:
Energy & Mining, Infrastructure
Last updated:
apr 23, 2017
Indicators value changes by year
Maximum:
10.835
jan 1, 2006
At the date of observation
Value
Absolute change
Change from previous value
jan 1, 1991
8.276
+0.035
0.43%
jan 1, 1992
7.557
-0.719
-8.68%
jan 1, 1993
6.474
-1.083
-14.33%
jan 1, 1994
7.003
+0.529
8.18%
jan 1, 1995
7.675
+0.672
9.59%
jan 1, 1996
7.519
-0.156
-2.03%
jan 1, 1997
8.038
+0.519
6.91%
jan 1, 1998
7.485
-0.553
-6.88%
jan 1, 1999
7.851
+0.366
4.89%
jan 1, 2000
7.672
-0.179
-2.28%
jan 1, 2001
6.836
-0.836
-10.9%
jan 1, 2002
7.413
+0.577
8.44%
jan 1, 2003
9.502
+2.089
28.18%
jan 1, 2004
7.111
-2.39
-25.16%
jan 1, 2005
10.724
+3.613
50.81%
jan 1, 2006
10.835
+0.111
1.04%
jan 1, 2007
9.946
-0.889
-8.21%
jan 1, 2008
10.033
+0.087
0.88%
jan 1, 2009
10.27
+0.237
2.36%
jan 1, 2010
10.591
+0.321
3.12%
jan 1, 2011
10.122
-0.469
-4.43%
jan 1, 2012
10.781
+0.659
6.51%
jan 1, 2013
10.645
-0.136
-1.26%
jan 1, 2014
10.581
-0.063
-0.6%
Ranking of countries by current statistics by years


Comments: