29
/
en
AIzaSyAYiBZKx7MnpbEhh9jyipgxe19OcubqV5w
April 1, 2024
58845
Sub-Saharan Africa
SSF
false
2
1
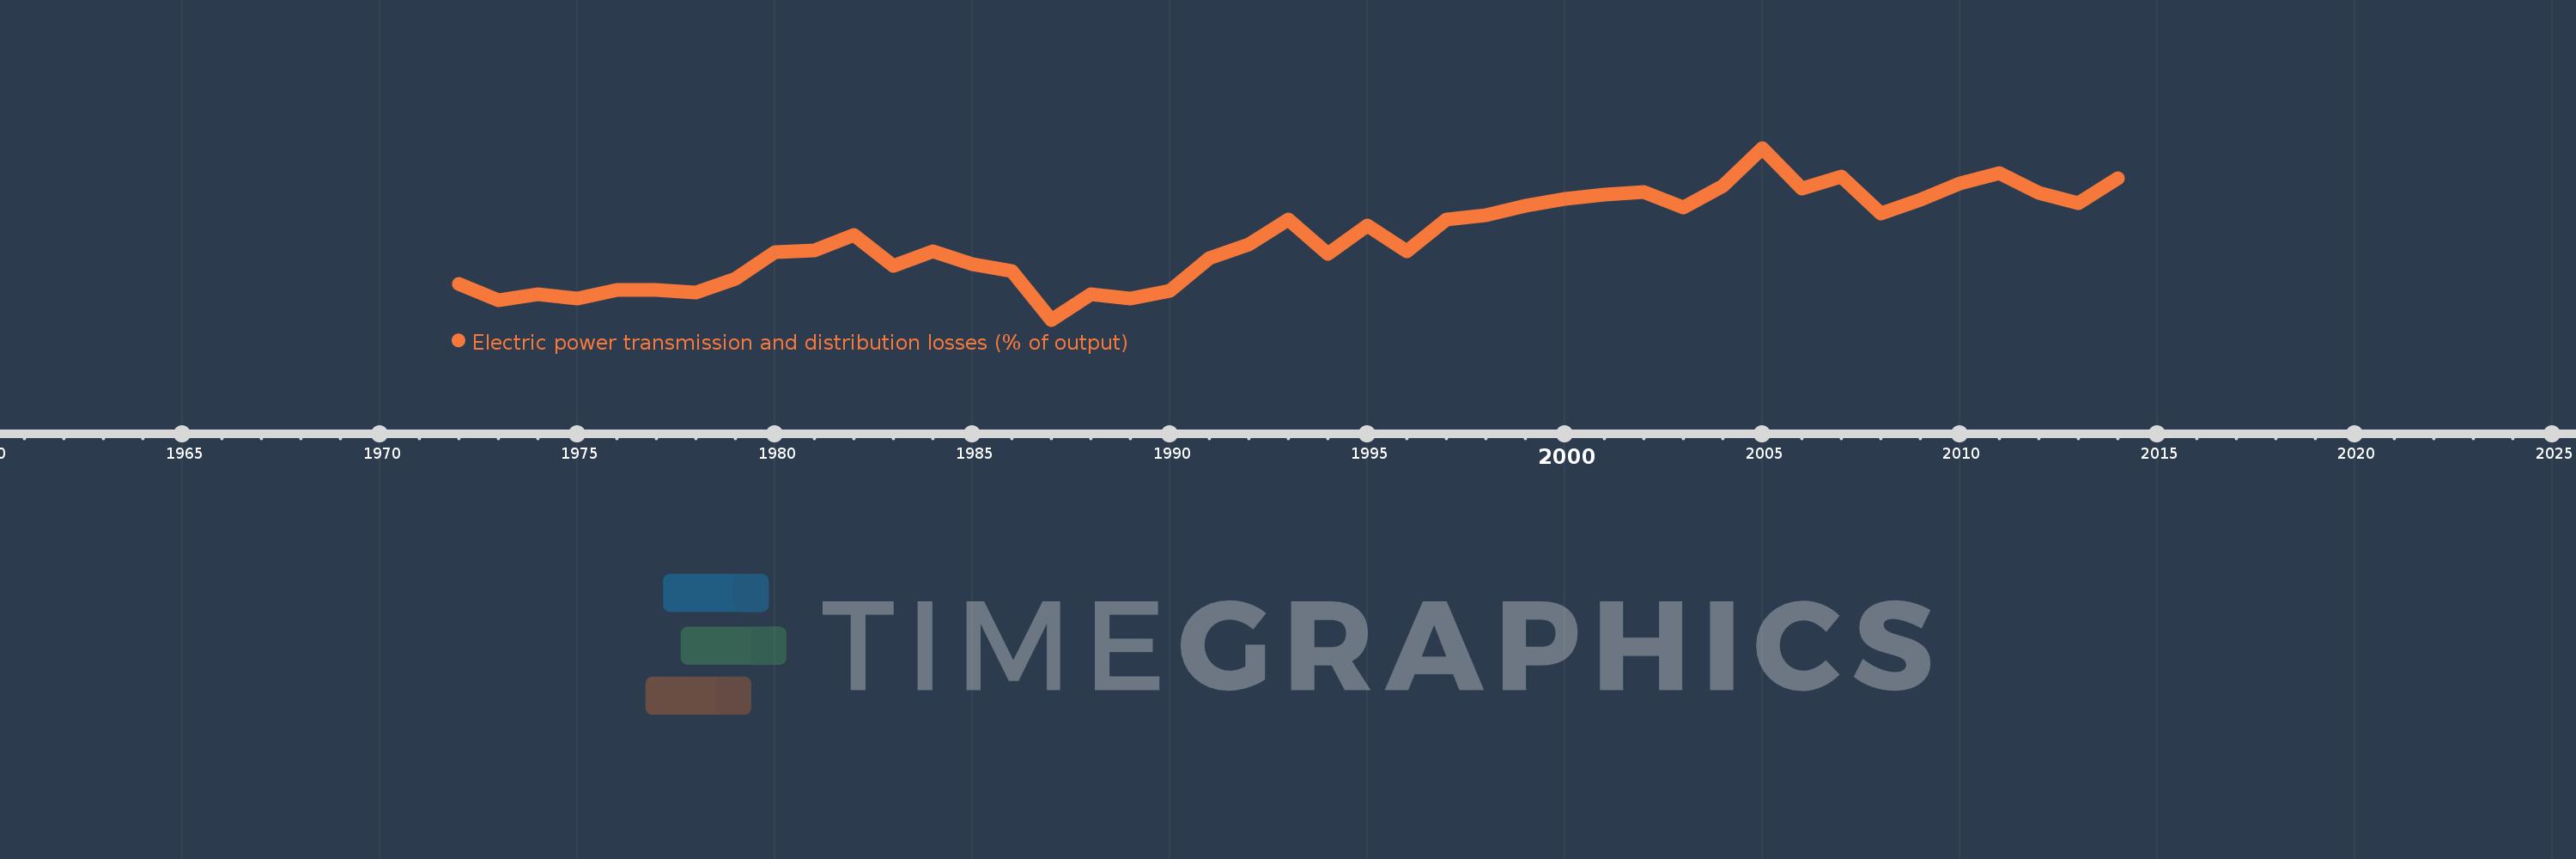
Electric power transmission and distribution losses (% of output)
2014,2013,2012,2011,2010,2009,2008,2007,2006,2005,2004,2003,2002,2001,2000,1999,1998,1997,1996,1995,1994,1993,1992,1991,1990,1989,1988,1987,1986,1985,1984,1983,1982,1981,1980,1979,1978,1977,1976,1975,1974,1973,1972
This statistics in other country:
AlbaniaAlgeriaAngolaArab WorldArgentinaArmeniaAustraliaAustriaAzerbaijanBahrainBangladeshBelarusBelgiumBeninBoliviaBosnia and HerzegovinaBotswanaBrazilBrunei DarussalamBulgariaCambodiaCameroonCanadaCaribbean small statesCentral Europe and the BalticsChileChinaColombiaCongo, Dem. Rep.Congo, Rep.Costa RicaCote d'IvoireCroatiaCubaCuracaoCyprusCzech RepublicDenmarkDominican RepublicEarly-demographic dividendEast Asia & PacificEast Asia & Pacific (excluding high income)East Asia & Pacific (IDA & IBRD countries)EcuadorEgypt, Arab Rep.El SalvadorEritreaEstoniaEthiopiaEuro areaEurope & Central AsiaEurope & Central Asia (excluding high income)Europe & Central Asia (IDA & IBRD countries)European UnionFinlandFragile and conflict affected situationsFranceGabonGeorgiaGermanyGhanaGibraltarGreeceGuatemalaHaitiHeavily indebted poor countries (HIPC)High incomeHondurasHong Kong SAR, ChinaHungaryIBRD onlyIcelandIDA & IBRD totalIDA blendIDA onlyIDA totalIndiaIndonesiaIran, Islamic Rep.IraqIrelandIsraelItalyJamaicaJapanJordanKazakhstanKenyaKorea, Dem. People’s Rep.Korea, Rep.KosovoKuwaitKyrgyz RepublicLate-demographic dividendLatin America & Caribbean Latin America & Caribbean (excluding high income)Latin America & the Caribbean (IDA & IBRD countries)LatviaLeast developed countries: UN classificationLebanonLibyaLithuaniaLow & middle incomeLow incomeLower middle incomeLuxembourgMacedonia, FYRMalaysiaMaltaMauritiusMexicoMiddle East & North AfricaMiddle East & North Africa (excluding high income)Middle East & North Africa (IDA & IBRD countries)Middle incomeMoldovaMongoliaMontenegroMoroccoMozambiqueMyanmarNamibiaNepalNetherlandsNew ZealandNicaraguaNigerNigeriaNorth AmericaNorwayOECD membersOmanOther small statesPakistanPanamaParaguayPeruPhilippinesPolandPortugalPost-demographic dividendPre-demographic dividendQatarRomaniaRussian FederationSaudi ArabiaSenegalSerbiaSingaporeSlovak RepublicSloveniaSmall statesSouth AfricaSouth AsiaSouth Asia (IDA & IBRD)South SudanSpainSri LankaSub-Saharan Africa Sub-Saharan Africa (excluding high income)Sub-Saharan Africa (IDA & IBRD countries)SudanSwedenSwitzerlandSyrian Arab RepublicTajikistanTanzaniaThailandTogoTrinidad and TobagoTunisiaTurkeyTurkmenistanUkraineUnited Arab EmiratesUnited KingdomUnited StatesUpper middle incomeUruguayUzbekistanVenezuela, RBVietnamWorldYemen, Rep.ZambiaZimbabwe Timeline:
This timeline shows a graph from 1972 to 2014 of Sub-Saharan Africa . No data until 1971. Number of actual observations by date: 43.
Source name:
World Development Indicators
Source organization:
IEA Statistics © OECD/IEA 2014 (http://www.iea.org/stats/index.asp), subject to https://www.iea.org/t&c/termsandconditions/
Categories, topics:
Energy & Mining, Infrastructure
Last updated:
apr 23, 2017
Indicators value changes by year
Maximum:
12.965
jan 1, 2005
At the date of observation
Value
Absolute change
Change from previous value
jan 1, 1972
7.942
+7.942
0.0%
jan 1, 1973
7.334
-0.608
-7.66%
jan 1, 1974
7.546
+0.212
2.89%
jan 1, 1975
7.395
-0.151
-2.0%
jan 1, 1976
7.694
+0.298
4.03%
jan 1, 1977
7.705
+0.012
0.15%
jan 1, 1978
7.615
-0.09
-1.17%
jan 1, 1979
8.125
+0.51
6.69%
jan 1, 1980
9.098
+0.973
11.97%
jan 1, 1981
9.164
+0.066
0.73%
jan 1, 1982
9.734
+0.57
6.22%
jan 1, 1983
8.589
-1.145
-11.77%
jan 1, 1984
9.141
+0.552
6.43%
jan 1, 1985
8.653
-0.487
-5.33%
jan 1, 1986
8.418
-0.235
-2.72%
jan 1, 1987
6.599
-1.819
-21.61%
jan 1, 1988
7.531
+0.933
14.14%
jan 1, 1989
7.397
-0.134
-1.79%
jan 1, 1990
7.659
+0.262
3.55%
jan 1, 1991
8.873
+1.214
15.85%
jan 1, 1992
9.392
+0.519
5.85%
jan 1, 1993
10.323
+0.931
9.91%
jan 1, 1994
9.051
-1.273
-12.33%
jan 1, 1995
10.084
+1.034
11.42%
jan 1, 1996
9.148
-0.936
-9.28%
jan 1, 1997
10.303
+1.155
12.62%
jan 1, 1998
10.478
+0.175
1.7%
jan 1, 1999
10.813
+0.335
3.19%
jan 1, 2000
11.093
+0.281
2.59%
jan 1, 2001
11.227
+0.134
1.21%
jan 1, 2002
11.322
+0.095
0.84%
jan 1, 2003
10.746
-0.575
-5.08%
jan 1, 2004
11.552
+0.805
7.5%
jan 1, 2005
12.965
+1.414
12.24%
jan 1, 2006
11.462
-1.503
-11.59%
jan 1, 2007
11.895
+0.433
3.78%
jan 1, 2008
10.544
-1.352
-11.36%
jan 1, 2009
11.041
+0.497
4.71%
jan 1, 2010
11.646
+0.605
5.48%
jan 1, 2011
12.038
+0.392
3.37%
jan 1, 2012
11.285
-0.753
-6.25%
jan 1, 2013
10.912
-0.373
-3.31%
jan 1, 2014
11.83
+0.918
8.41%
Ranking of countries by current statistics by years


Comments: