29
/
en
AIzaSyAYiBZKx7MnpbEhh9jyipgxe19OcubqV5w
April 1, 2024
24805
Caribbean small states
CSS
false
2
1
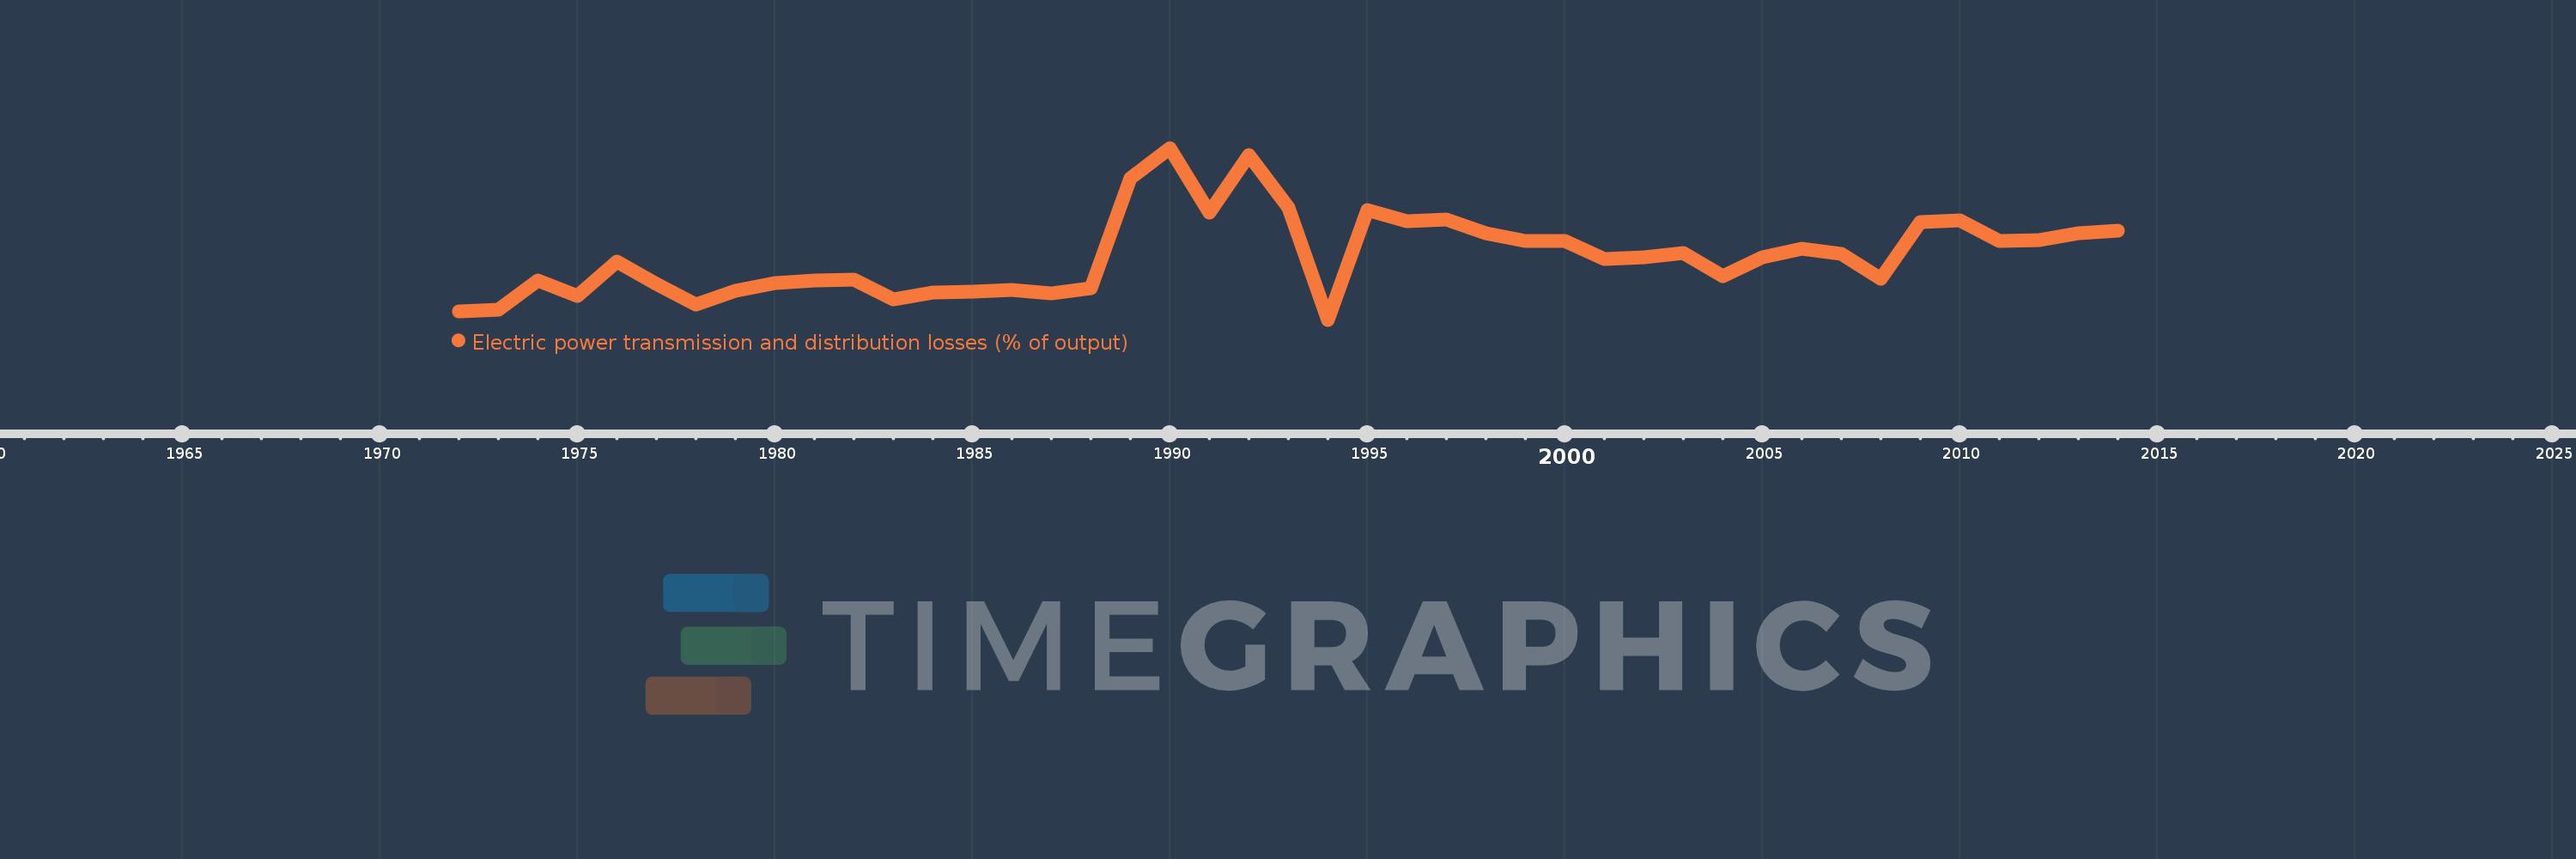
Electric power transmission and distribution losses (% of output)
2014,2013,2012,2011,2010,2009,2008,2007,2006,2005,2004,2003,2002,2001,2000,1999,1998,1997,1996,1995,1994,1993,1992,1991,1990,1989,1988,1987,1986,1985,1984,1983,1982,1981,1980,1979,1978,1977,1976,1975,1974,1973,1972
This statistics in other country:
AlbaniaAlgeriaAngolaArab WorldArgentinaArmeniaAustraliaAustriaAzerbaijanBahrainBangladeshBelarusBelgiumBeninBoliviaBosnia and HerzegovinaBotswanaBrazilBrunei DarussalamBulgariaCambodiaCameroonCanadaCaribbean small statesCentral Europe and the BalticsChileChinaColombiaCongo, Dem. Rep.Congo, Rep.Costa RicaCote d'IvoireCroatiaCubaCuracaoCyprusCzech RepublicDenmarkDominican RepublicEarly-demographic dividendEast Asia & PacificEast Asia & Pacific (excluding high income)East Asia & Pacific (IDA & IBRD countries)EcuadorEgypt, Arab Rep.El SalvadorEritreaEstoniaEthiopiaEuro areaEurope & Central AsiaEurope & Central Asia (excluding high income)Europe & Central Asia (IDA & IBRD countries)European UnionFinlandFragile and conflict affected situationsFranceGabonGeorgiaGermanyGhanaGibraltarGreeceGuatemalaHaitiHeavily indebted poor countries (HIPC)High incomeHondurasHong Kong SAR, ChinaHungaryIBRD onlyIcelandIDA & IBRD totalIDA blendIDA onlyIDA totalIndiaIndonesiaIran, Islamic Rep.IraqIrelandIsraelItalyJamaicaJapanJordanKazakhstanKenyaKorea, Dem. People’s Rep.Korea, Rep.KosovoKuwaitKyrgyz RepublicLate-demographic dividendLatin America & Caribbean Latin America & Caribbean (excluding high income)Latin America & the Caribbean (IDA & IBRD countries)LatviaLeast developed countries: UN classificationLebanonLibyaLithuaniaLow & middle incomeLow incomeLower middle incomeLuxembourgMacedonia, FYRMalaysiaMaltaMauritiusMexicoMiddle East & North AfricaMiddle East & North Africa (excluding high income)Middle East & North Africa (IDA & IBRD countries)Middle incomeMoldovaMongoliaMontenegroMoroccoMozambiqueMyanmarNamibiaNepalNetherlandsNew ZealandNicaraguaNigerNigeriaNorth AmericaNorwayOECD membersOmanOther small statesPakistanPanamaParaguayPeruPhilippinesPolandPortugalPost-demographic dividendPre-demographic dividendQatarRomaniaRussian FederationSaudi ArabiaSenegalSerbiaSingaporeSlovak RepublicSloveniaSmall statesSouth AfricaSouth AsiaSouth Asia (IDA & IBRD)South SudanSpainSri LankaSub-Saharan Africa Sub-Saharan Africa (excluding high income)Sub-Saharan Africa (IDA & IBRD countries)SudanSwedenSwitzerlandSyrian Arab RepublicTajikistanTanzaniaThailandTogoTrinidad and TobagoTunisiaTurkeyTurkmenistanUkraineUnited Arab EmiratesUnited KingdomUnited StatesUpper middle incomeUruguayUzbekistanVenezuela, RBVietnamWorldYemen, Rep.ZambiaZimbabwe Timeline:
This timeline shows a graph from 1972 to 2014 of Caribbean small states. No data until 1971. Number of actual observations by date: 43.
Source name:
World Development Indicators
Source organization:
IEA Statistics © OECD/IEA 2014 (http://www.iea.org/stats/index.asp), subject to https://www.iea.org/t&c/termsandconditions/
Categories, topics:
Energy & Mining, Infrastructure
Last updated:
apr 23, 2017
Indicators value changes by year
Maximum:
14.949
jan 1, 1990
At the date of observation
Value
Absolute change
Change from previous value
jan 1, 1972
4.649
+4.649
0.0%
jan 1, 1973
4.791
+0.141
3.04%
jan 1, 1974
6.622
+1.831
38.23%
jan 1, 1975
5.619
-1.003
-15.15%
jan 1, 1976
7.787
+2.168
38.59%
jan 1, 1977
6.398
-1.389
-17.83%
jan 1, 1978
5.108
-1.29
-20.16%
jan 1, 1979
5.97
+0.862
16.88%
jan 1, 1980
6.433
+0.463
7.76%
jan 1, 1981
6.629
+0.196
3.04%
jan 1, 1982
6.675
+0.046
0.7%
jan 1, 1983
5.401
-1.274
-19.09%
jan 1, 1984
5.847
+0.447
8.27%
jan 1, 1985
5.934
+0.087
1.49%
jan 1, 1986
6.01
+0.076
1.28%
jan 1, 1987
5.785
-0.225
-3.74%
jan 1, 1988
6.147
+0.362
6.26%
jan 1, 1989
13.017
+6.87
111.77%
jan 1, 1990
14.949
+1.932
14.84%
jan 1, 1991
10.886
-4.063
-27.18%
jan 1, 1992
14.479
+3.592
33.0%
jan 1, 1993
11.197
-3.281
-22.66%
jan 1, 1994
4.14
-7.057
-63.02%
jan 1, 1995
11.036
+6.895
166.54%
jan 1, 1996
10.33
-0.706
-6.4%
jan 1, 1997
10.426
+0.097
0.94%
jan 1, 1998
9.579
-0.847
-8.12%
jan 1, 1999
9.099
-0.48
-5.01%
jan 1, 2000
9.084
-0.015
-0.17%
jan 1, 2001
7.973
-1.111
-12.23%
jan 1, 2002
8.065
+0.092
1.15%
jan 1, 2003
8.316
+0.251
3.11%
jan 1, 2004
6.862
-1.455
-17.49%
jan 1, 2005
8.053
+1.192
17.37%
jan 1, 2006
8.584
+0.531
6.6%
jan 1, 2007
8.279
-0.305
-3.55%
jan 1, 2008
6.7
-1.58
-19.08%
jan 1, 2009
10.287
+3.588
53.55%
jan 1, 2010
10.391
+0.104
1.01%
jan 1, 2011
9.114
-1.278
-12.3%
jan 1, 2012
9.164
+0.051
0.56%
jan 1, 2013
9.57
+0.406
4.43%
jan 1, 2014
9.744
+0.173
1.81%
Ranking of countries by current statistics by years


Comments: