29
/
en
AIzaSyAYiBZKx7MnpbEhh9jyipgxe19OcubqV5w
April 1, 2024
169799
Korea, Rep.
KOR
true
2
1
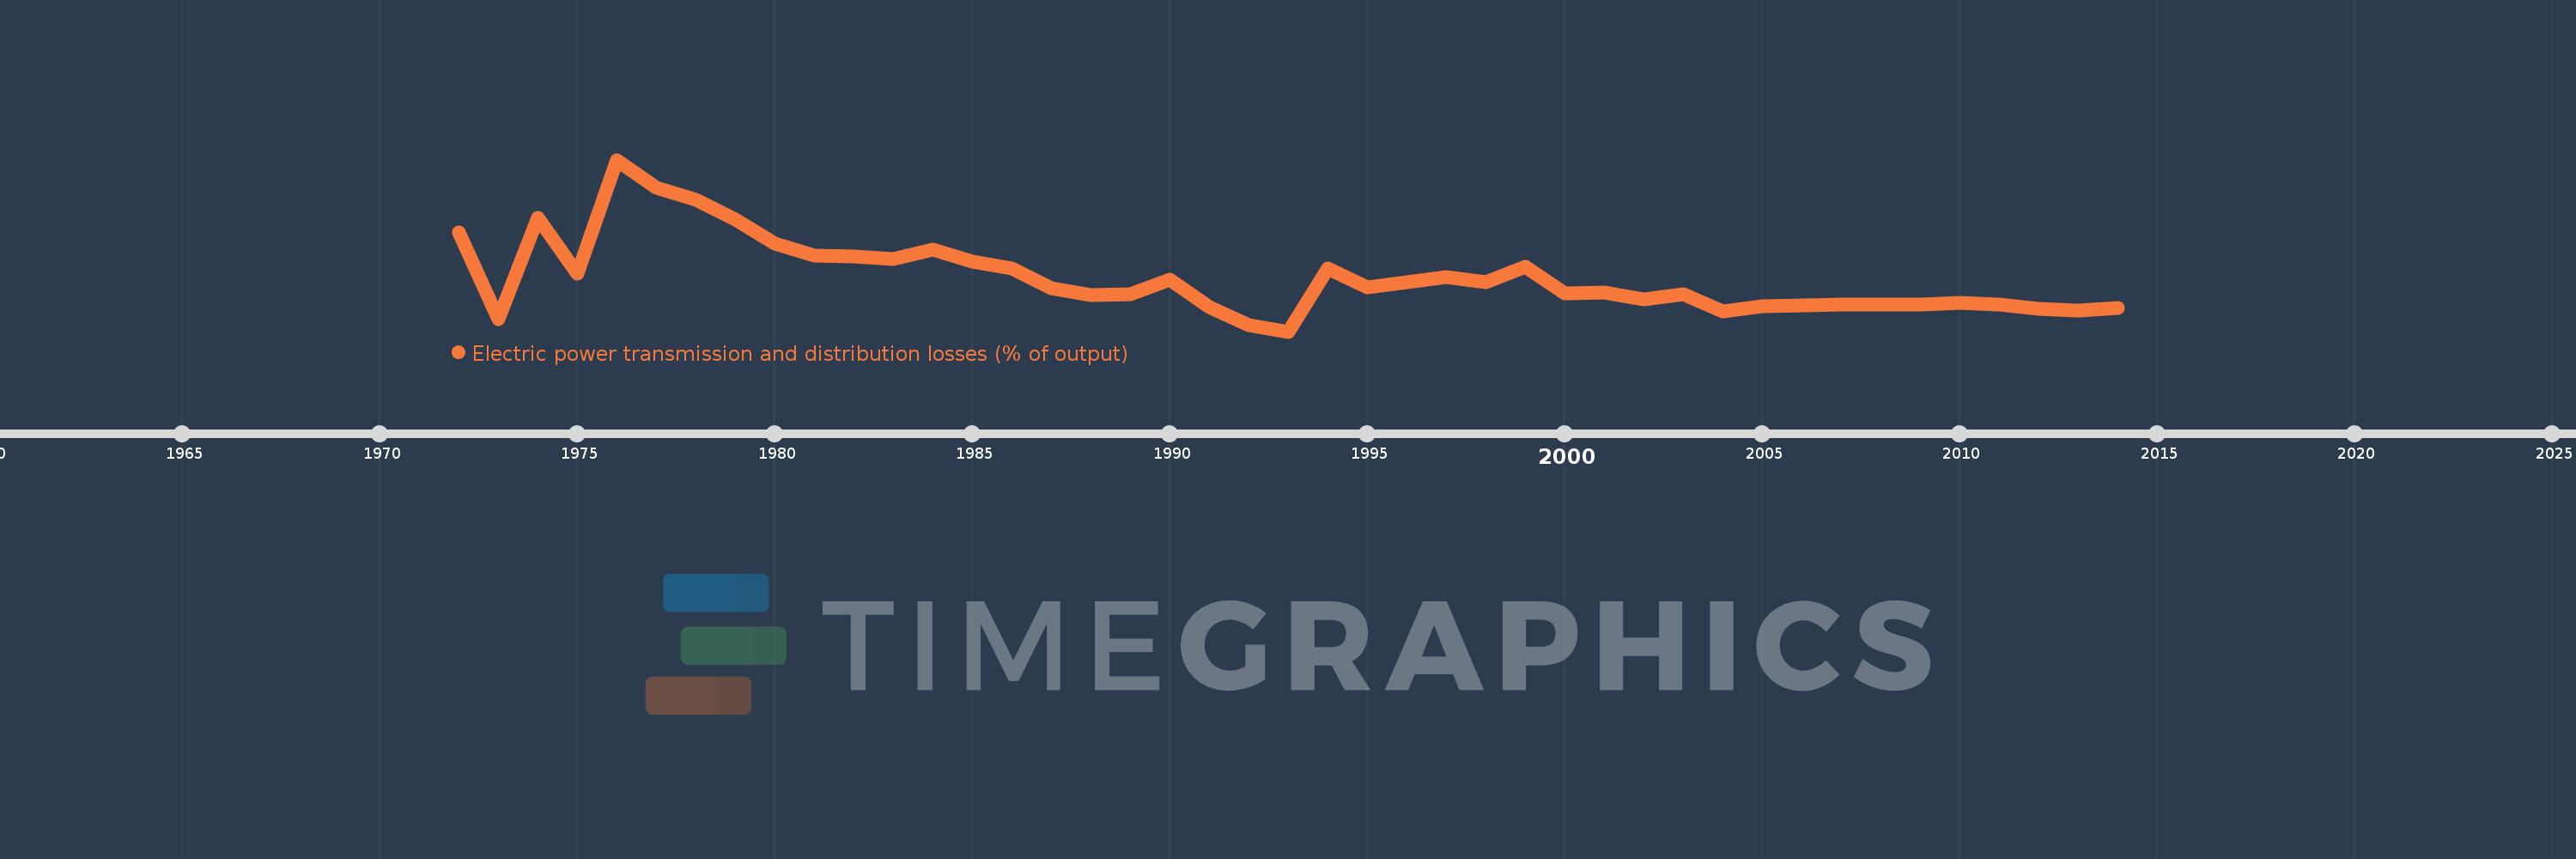
Electric power transmission and distribution losses (% of output)
2014,2013,2012,2011,2010,2009,2008,2007,2006,2005,2004,2003,2002,2001,2000,1999,1998,1997,1996,1995,1994,1993,1992,1991,1990,1989,1988,1987,1986,1985,1984,1983,1982,1981,1980,1979,1978,1977,1976,1975,1974,1973,1972
This statistics in other country:
AlbaniaAlgeriaAngolaArab WorldArgentinaArmeniaAustraliaAustriaAzerbaijanBahrainBangladeshBelarusBelgiumBeninBoliviaBosnia and HerzegovinaBotswanaBrazilBrunei DarussalamBulgariaCambodiaCameroonCanadaCaribbean small statesCentral Europe and the BalticsChileChinaColombiaCongo, Dem. Rep.Congo, Rep.Costa RicaCote d'IvoireCroatiaCubaCuracaoCyprusCzech RepublicDenmarkDominican RepublicEarly-demographic dividendEast Asia & PacificEast Asia & Pacific (excluding high income)East Asia & Pacific (IDA & IBRD countries)EcuadorEgypt, Arab Rep.El SalvadorEritreaEstoniaEthiopiaEuro areaEurope & Central AsiaEurope & Central Asia (excluding high income)Europe & Central Asia (IDA & IBRD countries)European UnionFinlandFragile and conflict affected situationsFranceGabonGeorgiaGermanyGhanaGibraltarGreeceGuatemalaHaitiHeavily indebted poor countries (HIPC)High incomeHondurasHong Kong SAR, ChinaHungaryIBRD onlyIcelandIDA & IBRD totalIDA blendIDA onlyIDA totalIndiaIndonesiaIran, Islamic Rep.IraqIrelandIsraelItalyJamaicaJapanJordanKazakhstanKenyaKorea, Dem. People’s Rep.Korea, Rep.KosovoKuwaitKyrgyz RepublicLate-demographic dividendLatin America & Caribbean Latin America & Caribbean (excluding high income)Latin America & the Caribbean (IDA & IBRD countries)LatviaLeast developed countries: UN classificationLebanonLibyaLithuaniaLow & middle incomeLow incomeLower middle incomeLuxembourgMacedonia, FYRMalaysiaMaltaMauritiusMexicoMiddle East & North AfricaMiddle East & North Africa (excluding high income)Middle East & North Africa (IDA & IBRD countries)Middle incomeMoldovaMongoliaMontenegroMoroccoMozambiqueMyanmarNamibiaNepalNetherlandsNew ZealandNicaraguaNigerNigeriaNorth AmericaNorwayOECD membersOmanOther small statesPakistanPanamaParaguayPeruPhilippinesPolandPortugalPost-demographic dividendPre-demographic dividendQatarRomaniaRussian FederationSaudi ArabiaSenegalSerbiaSingaporeSlovak RepublicSloveniaSmall statesSouth AfricaSouth AsiaSouth Asia (IDA & IBRD)South SudanSpainSri LankaSub-Saharan Africa Sub-Saharan Africa (excluding high income)Sub-Saharan Africa (IDA & IBRD countries)SudanSwedenSwitzerlandSyrian Arab RepublicTajikistanTanzaniaThailandTogoTrinidad and TobagoTunisiaTurkeyTurkmenistanUkraineUnited Arab EmiratesUnited KingdomUnited StatesUpper middle incomeUruguayUzbekistanVenezuela, RBVietnamWorldYemen, Rep.ZambiaZimbabwe Timeline:
This timeline shows a graph from 1972 to 2014 of Korea, Rep.. No data until 1971. Number of actual observations by date: 43.
Source name:
World Development Indicators
Source organization:
IEA Statistics © OECD/IEA 2014 (http://www.iea.org/stats/index.asp), subject to https://www.iea.org/t&c/termsandconditions/
Categories, topics:
Energy & Mining, Infrastructure
Last updated:
apr 23, 2017
Indicators value changes by year
Maximum:
12.023
jan 1, 1976
At the date of observation
Value
Absolute change
Change from previous value
jan 1, 1972
7.78
+7.78
0.0%
jan 1, 1973
2.762
-5.018
-64.5%
jan 1, 1974
8.654
+5.892
213.33%
jan 1, 1975
5.423
-3.231
-37.33%
jan 1, 1976
12.023
+6.6
121.69%
jan 1, 1977
10.378
-1.645
-13.68%
jan 1, 1978
9.715
-0.662
-6.38%
jan 1, 1979
8.543
-1.172
-12.06%
jan 1, 1980
7.16
-1.383
-16.19%
jan 1, 1981
6.466
-0.694
-9.69%
jan 1, 1982
6.407
-0.059
-0.92%
jan 1, 1983
6.261
-0.146
-2.27%
jan 1, 1984
6.805
+0.543
8.68%
jan 1, 1985
6.116
-0.688
-10.12%
jan 1, 1986
5.727
-0.389
-6.37%
jan 1, 1987
4.536
-1.191
-20.8%
jan 1, 1988
4.137
-0.399
-8.8%
jan 1, 1989
4.201
+0.065
1.56%
jan 1, 1990
5.076
+0.875
20.82%
jan 1, 1991
3.448
-1.628
-32.08%
jan 1, 1992
2.414
-1.034
-29.98%
jan 1, 1993
2.034
-0.38
-15.75%
jan 1, 1994
5.727
+3.694
181.62%
jan 1, 1995
4.619
-1.108
-19.35%
jan 1, 1996
4.886
+0.267
5.77%
jan 1, 1997
5.184
+0.299
6.11%
jan 1, 1998
4.928
-0.257
-4.95%
jan 1, 1999
5.81
+0.883
17.91%
jan 1, 2000
4.273
-1.537
-26.45%
jan 1, 2001
4.315
+0.042
0.98%
jan 1, 2002
3.911
-0.404
-9.37%
jan 1, 2003
4.216
+0.305
7.8%
jan 1, 2004
3.215
-1.001
-23.75%
jan 1, 2005
3.49
+0.275
8.56%
jan 1, 2006
3.539
+0.05
1.42%
jan 1, 2007
3.626
+0.087
2.45%
jan 1, 2008
3.603
-0.023
-0.64%
jan 1, 2009
3.628
+0.025
0.7%
jan 1, 2010
3.713
+0.085
2.34%
jan 1, 2011
3.631
-0.082
-2.21%
jan 1, 2012
3.352
-0.279
-7.69%
jan 1, 2013
3.257
-0.095
-2.83%
jan 1, 2014
3.404
+0.147
4.52%
Ranking of countries by current statistics by years


Comments: