29
/
en
AIzaSyAYiBZKx7MnpbEhh9jyipgxe19OcubqV5w
April 1, 2024
46026
Low income
LIC
false
2
1
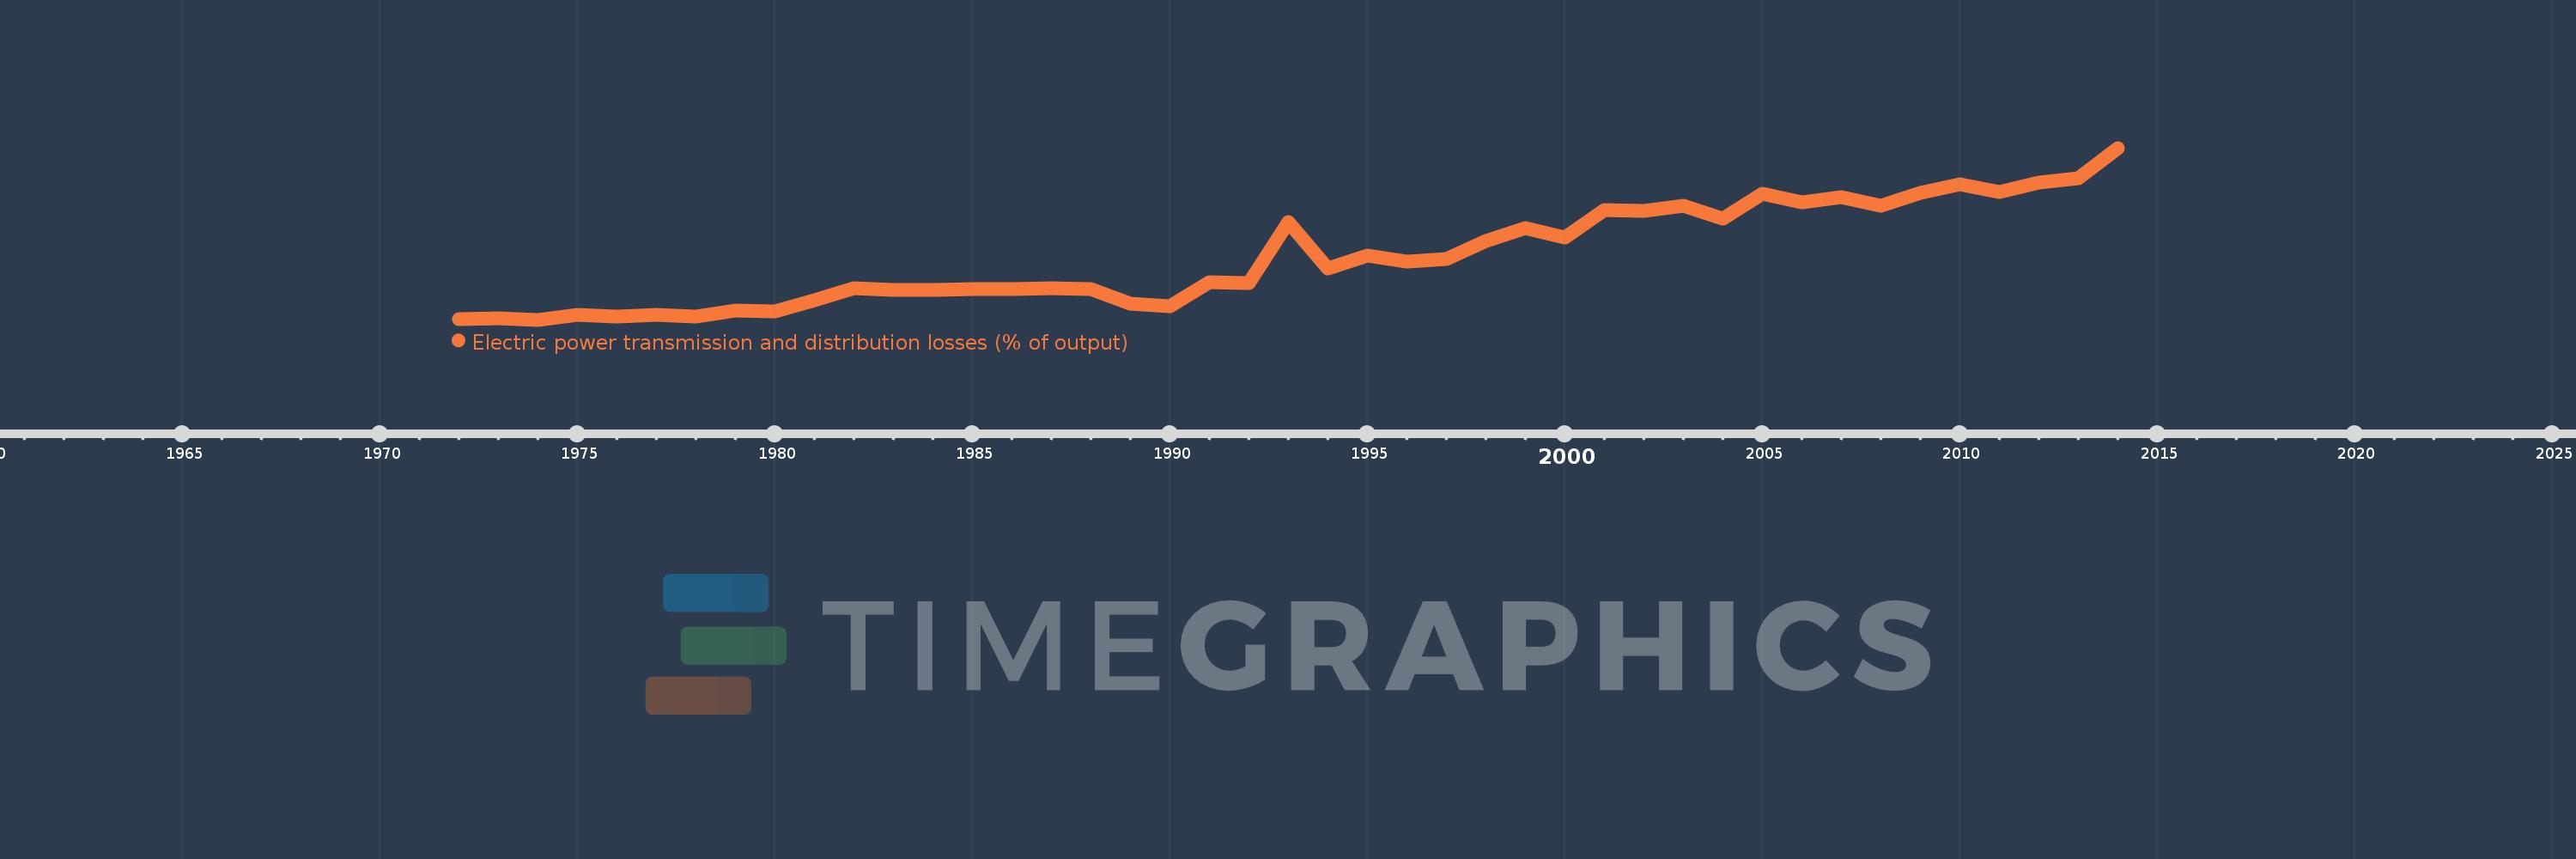
Electric power transmission and distribution losses (% of output)
2014,2013,2012,2011,2010,2009,2008,2007,2006,2005,2004,2003,2002,2001,2000,1999,1998,1997,1996,1995,1994,1993,1992,1991,1990,1989,1988,1987,1986,1985,1984,1983,1982,1981,1980,1979,1978,1977,1976,1975,1974,1973,1972
This statistics in other country:
AlbaniaAlgeriaAngolaArab WorldArgentinaArmeniaAustraliaAustriaAzerbaijanBahrainBangladeshBelarusBelgiumBeninBoliviaBosnia and HerzegovinaBotswanaBrazilBrunei DarussalamBulgariaCambodiaCameroonCanadaCaribbean small statesCentral Europe and the BalticsChileChinaColombiaCongo, Dem. Rep.Congo, Rep.Costa RicaCote d'IvoireCroatiaCubaCuracaoCyprusCzech RepublicDenmarkDominican RepublicEarly-demographic dividendEast Asia & PacificEast Asia & Pacific (excluding high income)East Asia & Pacific (IDA & IBRD countries)EcuadorEgypt, Arab Rep.El SalvadorEritreaEstoniaEthiopiaEuro areaEurope & Central AsiaEurope & Central Asia (excluding high income)Europe & Central Asia (IDA & IBRD countries)European UnionFinlandFragile and conflict affected situationsFranceGabonGeorgiaGermanyGhanaGibraltarGreeceGuatemalaHaitiHeavily indebted poor countries (HIPC)High incomeHondurasHong Kong SAR, ChinaHungaryIBRD onlyIcelandIDA & IBRD totalIDA blendIDA onlyIDA totalIndiaIndonesiaIran, Islamic Rep.IraqIrelandIsraelItalyJamaicaJapanJordanKazakhstanKenyaKorea, Dem. People’s Rep.Korea, Rep.KosovoKuwaitKyrgyz RepublicLate-demographic dividendLatin America & Caribbean Latin America & Caribbean (excluding high income)Latin America & the Caribbean (IDA & IBRD countries)LatviaLeast developed countries: UN classificationLebanonLibyaLithuaniaLow & middle incomeLow incomeLower middle incomeLuxembourgMacedonia, FYRMalaysiaMaltaMauritiusMexicoMiddle East & North AfricaMiddle East & North Africa (excluding high income)Middle East & North Africa (IDA & IBRD countries)Middle incomeMoldovaMongoliaMontenegroMoroccoMozambiqueMyanmarNamibiaNepalNetherlandsNew ZealandNicaraguaNigerNigeriaNorth AmericaNorwayOECD membersOmanOther small statesPakistanPanamaParaguayPeruPhilippinesPolandPortugalPost-demographic dividendPre-demographic dividendQatarRomaniaRussian FederationSaudi ArabiaSenegalSerbiaSingaporeSlovak RepublicSloveniaSmall statesSouth AfricaSouth AsiaSouth Asia (IDA & IBRD)South SudanSpainSri LankaSub-Saharan Africa Sub-Saharan Africa (excluding high income)Sub-Saharan Africa (IDA & IBRD countries)SudanSwedenSwitzerlandSyrian Arab RepublicTajikistanTanzaniaThailandTogoTrinidad and TobagoTunisiaTurkeyTurkmenistanUkraineUnited Arab EmiratesUnited KingdomUnited StatesUpper middle incomeUruguayUzbekistanVenezuela, RBVietnamWorldYemen, Rep.ZambiaZimbabwe Timeline:
This timeline shows a graph from 1972 to 2014 of Low income. No data until 1971. Number of actual observations by date: 43.
Source name:
World Development Indicators
Source organization:
IEA Statistics © OECD/IEA 2014 (http://www.iea.org/stats/index.asp), subject to https://www.iea.org/t&c/termsandconditions/
Categories, topics:
Energy & Mining, Infrastructure
Last updated:
apr 23, 2017
Indicators value changes by year
Maximum:
18.918
jan 1, 2014
At the date of observation
Value
Absolute change
Change from previous value
jan 1, 1972
9.037
+9.037
0.0%
jan 1, 1973
9.083
+0.047
0.52%
jan 1, 1974
9.017
-0.067
-0.73%
jan 1, 1975
9.322
+0.305
3.38%
jan 1, 1976
9.216
-0.105
-1.13%
jan 1, 1977
9.308
+0.092
1.0%
jan 1, 1978
9.201
-0.107
-1.15%
jan 1, 1979
9.522
+0.321
3.48%
jan 1, 1980
9.51
-0.012
-0.13%
jan 1, 1981
10.133
+0.623
6.55%
jan 1, 1982
10.838
+0.706
6.96%
jan 1, 1983
10.719
-0.119
-1.1%
jan 1, 1984
10.75
+0.031
0.29%
jan 1, 1985
10.8
+0.049
0.46%
jan 1, 1986
10.801
+0.001
0.01%
jan 1, 1987
10.823
+0.022
0.21%
jan 1, 1988
10.779
-0.044
-0.41%
jan 1, 1989
9.962
-0.817
-7.58%
jan 1, 1990
9.808
-0.154
-1.54%
jan 1, 1991
11.189
+1.381
14.08%
jan 1, 1992
11.125
-0.064
-0.57%
jan 1, 1993
14.642
+3.517
31.61%
jan 1, 1994
11.948
-2.694
-18.4%
jan 1, 1995
12.737
+0.789
6.61%
jan 1, 1996
12.385
-0.353
-2.77%
jan 1, 1997
12.517
+0.132
1.06%
jan 1, 1998
13.567
+1.051
8.4%
jan 1, 1999
14.309
+0.741
5.46%
jan 1, 2000
13.739
-0.57
-3.98%
jan 1, 2001
15.323
+1.584
11.53%
jan 1, 2002
15.294
-0.029
-0.19%
jan 1, 2003
15.59
+0.296
1.93%
jan 1, 2004
14.833
-0.757
-4.86%
jan 1, 2005
16.286
+1.453
9.8%
jan 1, 2006
15.806
-0.48
-2.95%
jan 1, 2007
16.081
+0.276
1.74%
jan 1, 2008
15.592
-0.489
-3.04%
jan 1, 2009
16.328
+0.736
4.72%
jan 1, 2010
16.813
+0.484
2.97%
jan 1, 2011
16.358
-0.454
-2.7%
jan 1, 2012
16.909
+0.551
3.37%
jan 1, 2013
17.195
+0.286
1.69%
jan 1, 2014
18.918
+1.723
10.02%
Ranking of countries by current statistics by years


Comments: