29
/
en
AIzaSyAYiBZKx7MnpbEhh9jyipgxe19OcubqV5w
April 1, 2024
224732
Poland
POL
true
2
1
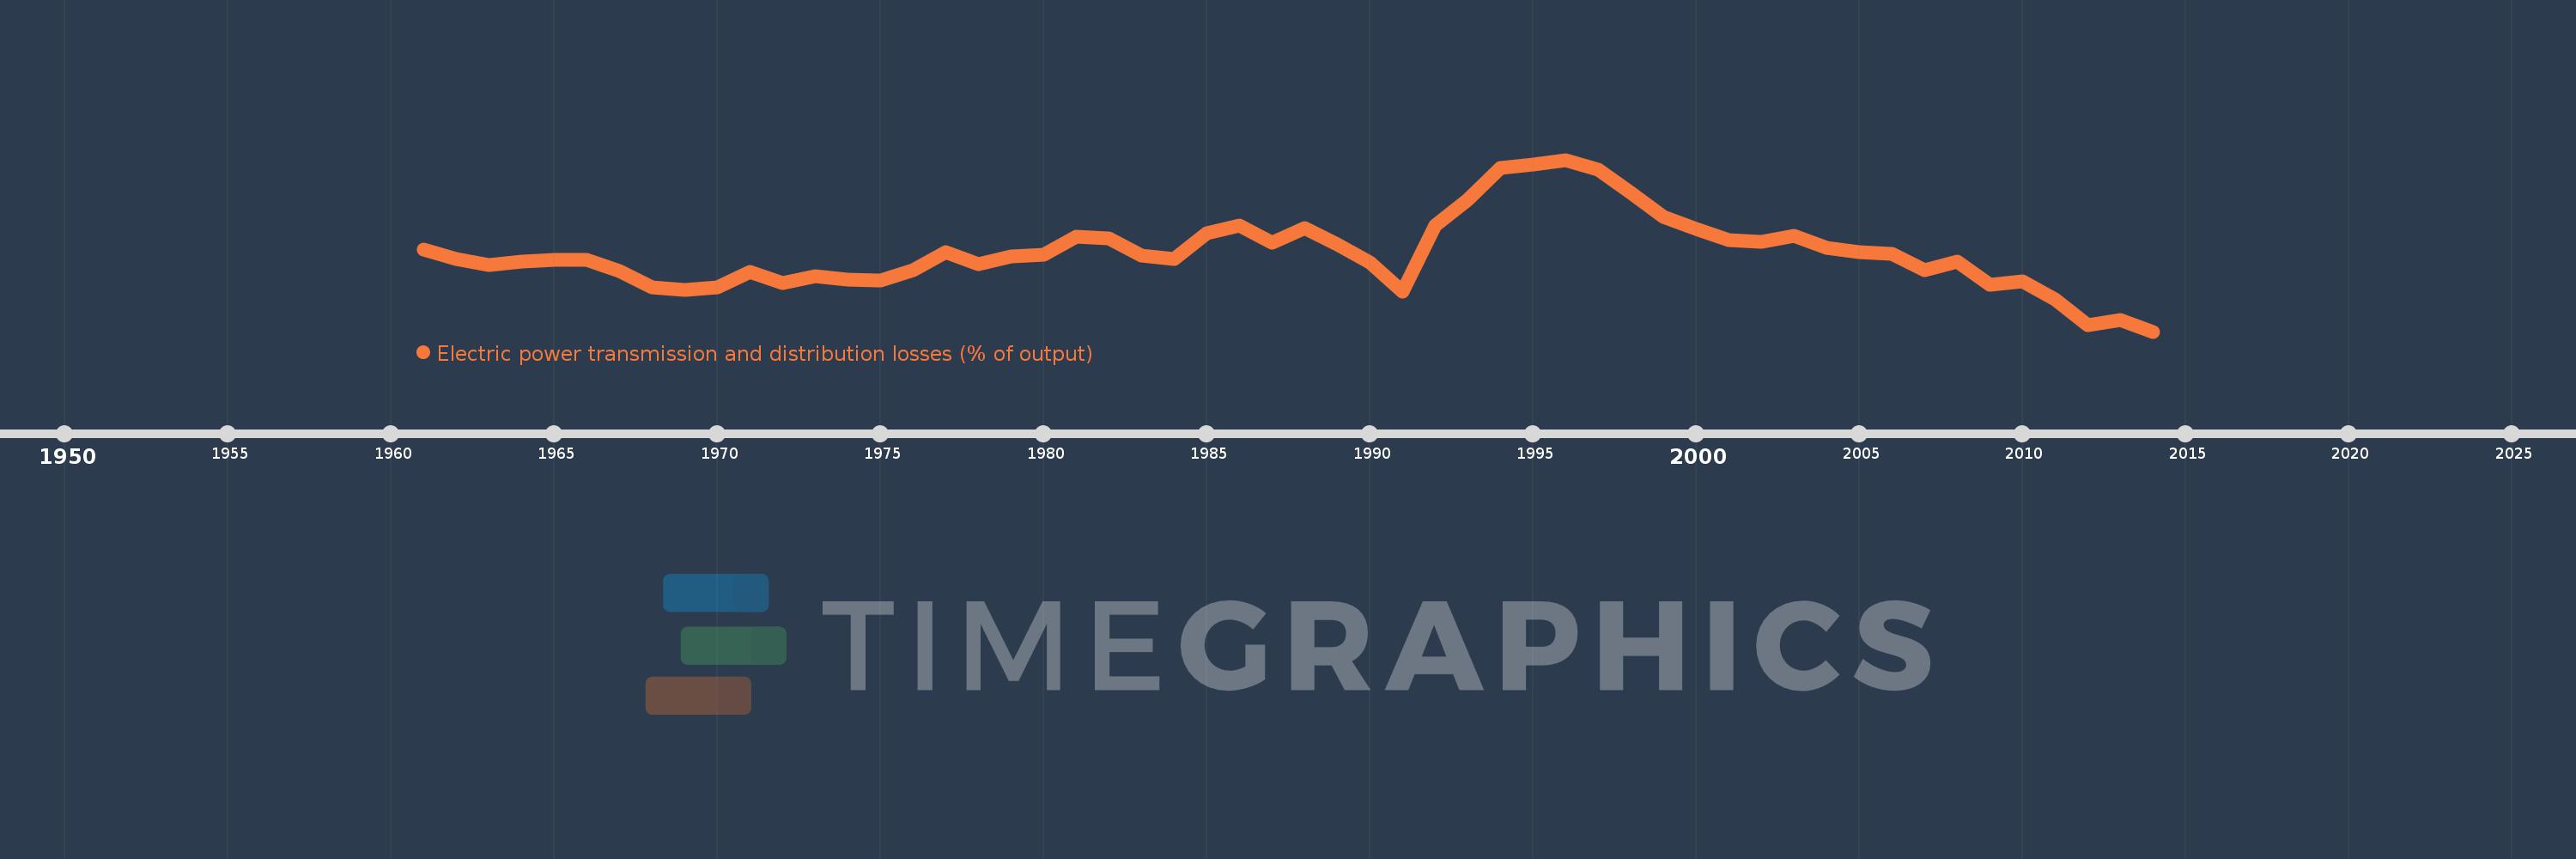
Electric power transmission and distribution losses (% of output)
2014,2013,2012,2011,2010,2009,2008,2007,2006,2005,2004,2003,2002,2001,2000,1999,1998,1997,1996,1995,1994,1993,1992,1991,1990,1989,1988,1987,1986,1985,1984,1983,1982,1981,1980,1979,1978,1977,1976,1975,1974,1973,1972,1971,1970,1969,1968,1967,1966,1965,1964,1963,1962,1961
This statistics in other country:
AlbaniaAlgeriaAngolaArab WorldArgentinaArmeniaAustraliaAustriaAzerbaijanBahrainBangladeshBelarusBelgiumBeninBoliviaBosnia and HerzegovinaBotswanaBrazilBrunei DarussalamBulgariaCambodiaCameroonCanadaCaribbean small statesCentral Europe and the BalticsChileChinaColombiaCongo, Dem. Rep.Congo, Rep.Costa RicaCote d'IvoireCroatiaCubaCuracaoCyprusCzech RepublicDenmarkDominican RepublicEarly-demographic dividendEast Asia & PacificEast Asia & Pacific (excluding high income)East Asia & Pacific (IDA & IBRD countries)EcuadorEgypt, Arab Rep.El SalvadorEritreaEstoniaEthiopiaEuro areaEurope & Central AsiaEurope & Central Asia (excluding high income)Europe & Central Asia (IDA & IBRD countries)European UnionFinlandFragile and conflict affected situationsFranceGabonGeorgiaGermanyGhanaGibraltarGreeceGuatemalaHaitiHeavily indebted poor countries (HIPC)High incomeHondurasHong Kong SAR, ChinaHungaryIBRD onlyIcelandIDA & IBRD totalIDA blendIDA onlyIDA totalIndiaIndonesiaIran, Islamic Rep.IraqIrelandIsraelItalyJamaicaJapanJordanKazakhstanKenyaKorea, Dem. People’s Rep.Korea, Rep.KosovoKuwaitKyrgyz RepublicLate-demographic dividendLatin America & Caribbean Latin America & Caribbean (excluding high income)Latin America & the Caribbean (IDA & IBRD countries)LatviaLeast developed countries: UN classificationLebanonLibyaLithuaniaLow & middle incomeLow incomeLower middle incomeLuxembourgMacedonia, FYRMalaysiaMaltaMauritiusMexicoMiddle East & North AfricaMiddle East & North Africa (excluding high income)Middle East & North Africa (IDA & IBRD countries)Middle incomeMoldovaMongoliaMontenegroMoroccoMozambiqueMyanmarNamibiaNepalNetherlandsNew ZealandNicaraguaNigerNigeriaNorth AmericaNorwayOECD membersOmanOther small statesPakistanPanamaParaguayPeruPhilippinesPolandPortugalPost-demographic dividendPre-demographic dividendQatarRomaniaRussian FederationSaudi ArabiaSenegalSerbiaSingaporeSlovak RepublicSloveniaSmall statesSouth AfricaSouth AsiaSouth Asia (IDA & IBRD)South SudanSpainSri LankaSub-Saharan Africa Sub-Saharan Africa (excluding high income)Sub-Saharan Africa (IDA & IBRD countries)SudanSwedenSwitzerlandSyrian Arab RepublicTajikistanTanzaniaThailandTogoTrinidad and TobagoTunisiaTurkeyTurkmenistanUkraineUnited Arab EmiratesUnited KingdomUnited StatesUpper middle incomeUruguayUzbekistanVenezuela, RBVietnamWorldYemen, Rep.ZambiaZimbabwe Timeline:
This timeline shows a graph from 1961 to 2014 of Poland. No data until 1960. Number of actual observations by date: 54.
Source name:
World Development Indicators
Source organization:
IEA Statistics © OECD/IEA 2014 (http://www.iea.org/stats/index.asp), subject to https://www.iea.org/t&c/termsandconditions/
Categories, topics:
Energy & Mining, Infrastructure
Last updated:
apr 23, 2017
Indicators value changes by year
Maximum:
13.186
jan 1, 1996
At the date of observation
Value
Absolute change
Change from previous value
jan 1, 1961
9.562
+9.562
0.0%
jan 1, 1962
9.169
-0.393
-4.11%
jan 1, 1963
8.95
-0.219
-2.39%
jan 1, 1964
9.077
+0.127
1.42%
jan 1, 1965
9.145
+0.068
0.75%
jan 1, 1966
9.16
+0.015
0.17%
jan 1, 1967
8.7
-0.46
-5.02%
jan 1, 1968
8.02
-0.68
-7.82%
jan 1, 1969
7.945
-0.075
-0.94%
jan 1, 1970
8.033
+0.088
1.11%
jan 1, 1971
8.642
+0.61
7.59%
jan 1, 1972
8.193
-0.449
-5.2%
jan 1, 1973
8.499
+0.306
3.74%
jan 1, 1974
8.346
-0.153
-1.8%
jan 1, 1975
8.297
-0.049
-0.58%
jan 1, 1976
8.73
+0.432
5.21%
jan 1, 1977
9.47
+0.74
8.47%
jan 1, 1978
8.968
-0.502
-5.3%
jan 1, 1979
9.28
+0.312
3.48%
jan 1, 1980
9.356
+0.077
0.83%
jan 1, 1981
10.083
+0.727
7.77%
jan 1, 1982
10.01
-0.074
-0.73%
jan 1, 1983
9.307
-0.702
-7.02%
jan 1, 1984
9.171
-0.136
-1.46%
jan 1, 1985
10.226
+1.055
11.5%
jan 1, 1986
10.539
+0.313
3.07%
jan 1, 1987
9.827
-0.712
-6.76%
jan 1, 1988
10.431
+0.604
6.15%
jan 1, 1989
9.769
-0.662
-6.35%
jan 1, 1990
9.036
-0.732
-7.5%
jan 1, 1991
7.856
-1.18
-13.06%
jan 1, 1992
10.535
+2.679
34.1%
jan 1, 1993
11.56
+1.025
9.73%
jan 1, 1994
12.847
+1.286
11.12%
jan 1, 1995
12.981
+0.135
1.05%
jan 1, 1996
13.186
+0.205
1.58%
jan 1, 1997
12.772
-0.414
-3.14%
jan 1, 1998
11.839
-0.933
-7.31%
jan 1, 1999
10.895
-0.944
-7.97%
jan 1, 2000
10.408
-0.487
-4.47%
jan 1, 2001
9.942
-0.467
-4.48%
jan 1, 2002
9.878
-0.064
-0.64%
jan 1, 2003
10.105
+0.227
2.3%
jan 1, 2004
9.639
-0.466
-4.61%
jan 1, 2005
9.46
-0.18
-1.86%
jan 1, 2006
9.374
-0.086
-0.91%
jan 1, 2007
8.721
-0.652
-6.96%
jan 1, 2008
9.08
+0.359
4.11%
jan 1, 2009
8.137
-0.943
-10.39%
jan 1, 2010
8.293
+0.156
1.92%
jan 1, 2011
7.544
-0.749
-9.03%
jan 1, 2012
6.522
-1.022
-13.55%
jan 1, 2013
6.731
+0.209
3.2%
jan 1, 2014
6.248
-0.482
-7.17%
Ranking of countries by current statistics by years


Comments: