29
/
en
AIzaSyAYiBZKx7MnpbEhh9jyipgxe19OcubqV5w
April 1, 2024
277555
Uruguay
URY
true
2
1
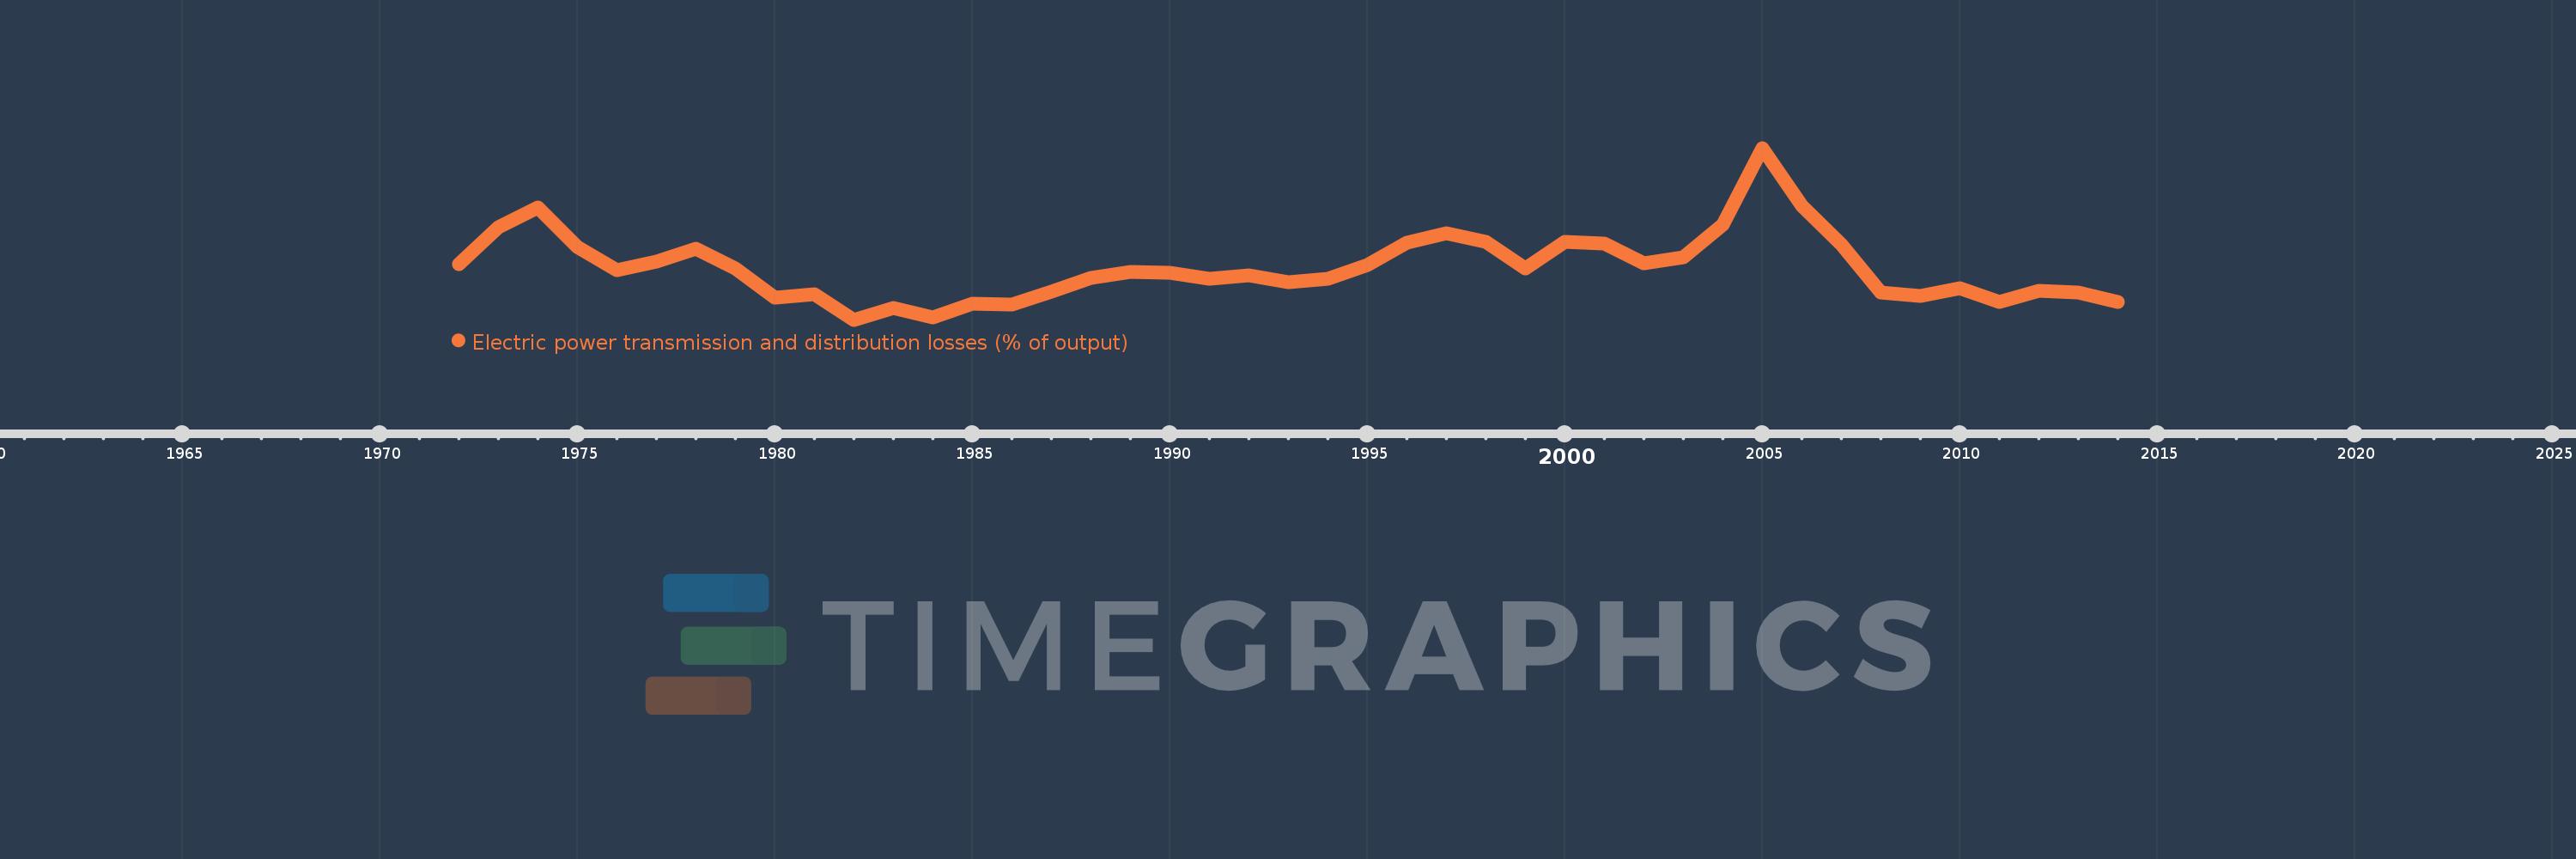
Electric power transmission and distribution losses (% of output)
2014,2013,2012,2011,2010,2009,2008,2007,2006,2005,2004,2003,2002,2001,2000,1999,1998,1997,1996,1995,1994,1993,1992,1991,1990,1989,1988,1987,1986,1985,1984,1983,1982,1981,1980,1979,1978,1977,1976,1975,1974,1973,1972
This statistics in other country:
AlbaniaAlgeriaAngolaArab WorldArgentinaArmeniaAustraliaAustriaAzerbaijanBahrainBangladeshBelarusBelgiumBeninBoliviaBosnia and HerzegovinaBotswanaBrazilBrunei DarussalamBulgariaCambodiaCameroonCanadaCaribbean small statesCentral Europe and the BalticsChileChinaColombiaCongo, Dem. Rep.Congo, Rep.Costa RicaCote d'IvoireCroatiaCubaCuracaoCyprusCzech RepublicDenmarkDominican RepublicEarly-demographic dividendEast Asia & PacificEast Asia & Pacific (excluding high income)East Asia & Pacific (IDA & IBRD countries)EcuadorEgypt, Arab Rep.El SalvadorEritreaEstoniaEthiopiaEuro areaEurope & Central AsiaEurope & Central Asia (excluding high income)Europe & Central Asia (IDA & IBRD countries)European UnionFinlandFragile and conflict affected situationsFranceGabonGeorgiaGermanyGhanaGibraltarGreeceGuatemalaHaitiHeavily indebted poor countries (HIPC)High incomeHondurasHong Kong SAR, ChinaHungaryIBRD onlyIcelandIDA & IBRD totalIDA blendIDA onlyIDA totalIndiaIndonesiaIran, Islamic Rep.IraqIrelandIsraelItalyJamaicaJapanJordanKazakhstanKenyaKorea, Dem. People’s Rep.Korea, Rep.KosovoKuwaitKyrgyz RepublicLate-demographic dividendLatin America & Caribbean Latin America & Caribbean (excluding high income)Latin America & the Caribbean (IDA & IBRD countries)LatviaLeast developed countries: UN classificationLebanonLibyaLithuaniaLow & middle incomeLow incomeLower middle incomeLuxembourgMacedonia, FYRMalaysiaMaltaMauritiusMexicoMiddle East & North AfricaMiddle East & North Africa (excluding high income)Middle East & North Africa (IDA & IBRD countries)Middle incomeMoldovaMongoliaMontenegroMoroccoMozambiqueMyanmarNamibiaNepalNetherlandsNew ZealandNicaraguaNigerNigeriaNorth AmericaNorwayOECD membersOmanOther small statesPakistanPanamaParaguayPeruPhilippinesPolandPortugalPost-demographic dividendPre-demographic dividendQatarRomaniaRussian FederationSaudi ArabiaSenegalSerbiaSingaporeSlovak RepublicSloveniaSmall statesSouth AfricaSouth AsiaSouth Asia (IDA & IBRD)South SudanSpainSri LankaSub-Saharan Africa Sub-Saharan Africa (excluding high income)Sub-Saharan Africa (IDA & IBRD countries)SudanSwedenSwitzerlandSyrian Arab RepublicTajikistanTanzaniaThailandTogoTrinidad and TobagoTunisiaTurkeyTurkmenistanUkraineUnited Arab EmiratesUnited KingdomUnited StatesUpper middle incomeUruguayUzbekistanVenezuela, RBVietnamWorldYemen, Rep.ZambiaZimbabwe Timeline:
This timeline shows a graph from 1972 to 2014 of Uruguay. No data until 1971. Number of actual observations by date: 43.
Source name:
World Development Indicators
Source organization:
IEA Statistics © OECD/IEA 2014 (http://www.iea.org/stats/index.asp), subject to https://www.iea.org/t&c/termsandconditions/
Categories, topics:
Energy & Mining, Infrastructure
Last updated:
apr 23, 2017
Indicators value changes by year
Maximum:
30.726
jan 1, 2005
At the date of observation
Value
Absolute change
Change from previous value
jan 1, 1972
15.886
+15.886
0.0%
jan 1, 1973
20.552
+4.666
29.37%
jan 1, 1974
23.05
+2.498
12.15%
jan 1, 1975
18.091
-4.959
-21.51%
jan 1, 1976
15.088
-3.003
-16.6%
jan 1, 1977
16.173
+1.086
7.2%
jan 1, 1978
17.863
+1.69
10.45%
jan 1, 1979
15.3
-2.563
-14.35%
jan 1, 1980
11.558
-3.742
-24.46%
jan 1, 1981
11.957
+0.399
3.45%
jan 1, 1982
8.724
-3.232
-27.03%
jan 1, 1983
10.185
+1.461
16.75%
jan 1, 1984
9.009
-1.176
-11.55%
jan 1, 1985
10.791
+1.782
19.78%
jan 1, 1986
10.625
-0.166
-1.54%
jan 1, 1987
12.284
+1.659
15.62%
jan 1, 1988
14.072
+1.788
14.55%
jan 1, 1989
14.833
+0.761
5.41%
jan 1, 1990
14.73
-0.103
-0.69%
jan 1, 1991
13.917
-0.813
-5.52%
jan 1, 1992
14.461
+0.544
3.91%
jan 1, 1993
13.541
-0.92
-6.36%
jan 1, 1994
13.963
+0.423
3.12%
jan 1, 1995
15.737
+1.774
12.7%
jan 1, 1996
18.598
+2.861
18.18%
jan 1, 1997
19.82
+1.222
6.57%
jan 1, 1998
18.747
-1.074
-5.42%
jan 1, 1999
15.301
-3.445
-18.38%
jan 1, 2000
18.724
+3.423
22.37%
jan 1, 2001
18.529
-0.195
-1.04%
jan 1, 2002
15.978
-2.551
-13.77%
jan 1, 2003
16.731
+0.752
4.71%
jan 1, 2004
20.888
+4.157
24.85%
jan 1, 2005
30.726
+9.838
47.1%
jan 1, 2006
23.327
-7.399
-24.08%
jan 1, 2007
18.426
-4.901
-21.01%
jan 1, 2008
12.2
-6.226
-33.79%
jan 1, 2009
11.792
-0.409
-3.35%
jan 1, 2010
12.766
+0.975
8.27%
jan 1, 2011
11.023
-1.743
-13.65%
jan 1, 2012
12.442
+1.419
12.87%
jan 1, 2013
12.192
-0.25
-2.01%
jan 1, 2014
10.993
-1.199
-9.84%
Ranking of countries by current statistics by years


Comments: