29
/
en
AIzaSyAYiBZKx7MnpbEhh9jyipgxe19OcubqV5w
April 1, 2024
163654
Japan
JPN
true
2
1
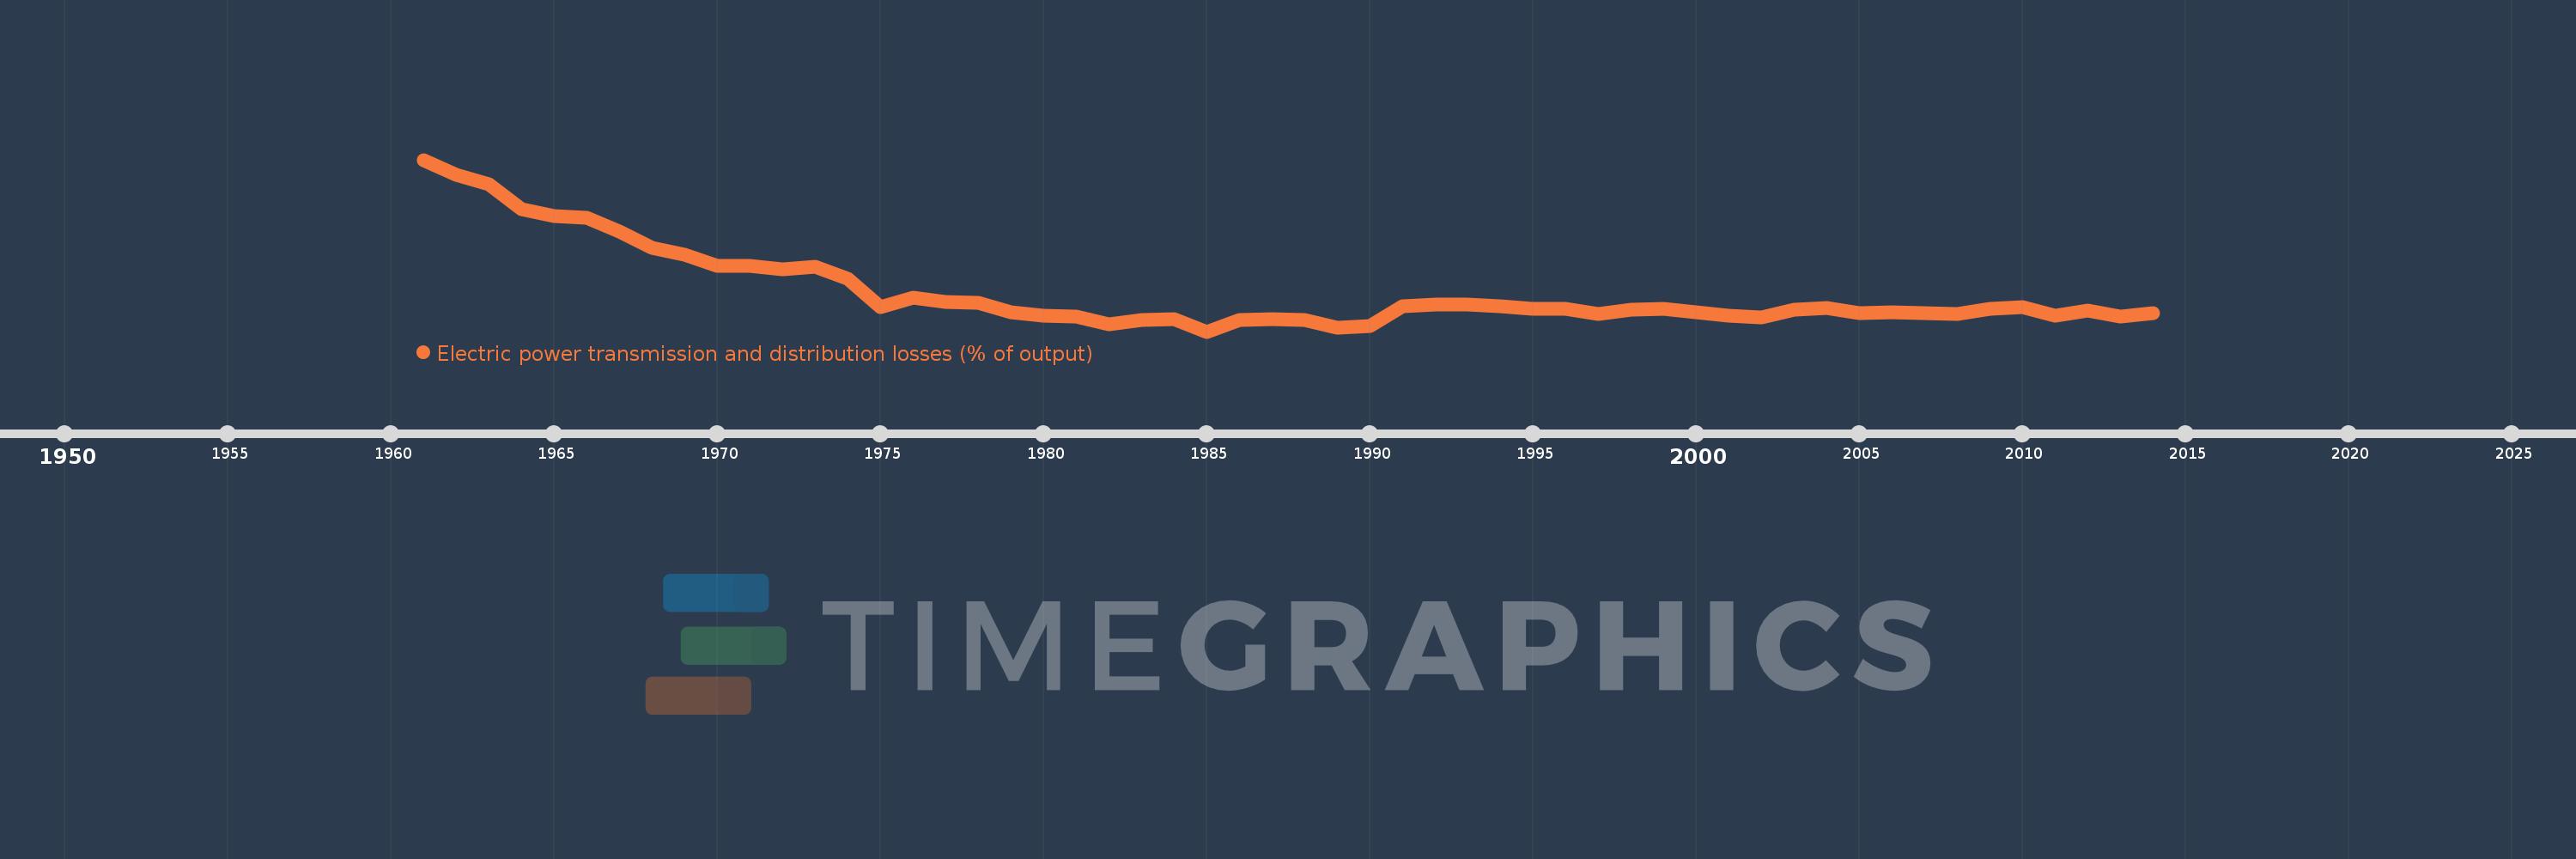
Electric power transmission and distribution losses (% of output)
2014,2013,2012,2011,2010,2009,2008,2007,2006,2005,2004,2003,2002,2001,2000,1999,1998,1997,1996,1995,1994,1993,1992,1991,1990,1989,1988,1987,1986,1985,1984,1983,1982,1981,1980,1979,1978,1977,1976,1975,1974,1973,1972,1971,1970,1969,1968,1967,1966,1965,1964,1963,1962,1961
This statistics in other country:
AlbaniaAlgeriaAngolaArab WorldArgentinaArmeniaAustraliaAustriaAzerbaijanBahrainBangladeshBelarusBelgiumBeninBoliviaBosnia and HerzegovinaBotswanaBrazilBrunei DarussalamBulgariaCambodiaCameroonCanadaCaribbean small statesCentral Europe and the BalticsChileChinaColombiaCongo, Dem. Rep.Congo, Rep.Costa RicaCote d'IvoireCroatiaCubaCuracaoCyprusCzech RepublicDenmarkDominican RepublicEarly-demographic dividendEast Asia & PacificEast Asia & Pacific (excluding high income)East Asia & Pacific (IDA & IBRD countries)EcuadorEgypt, Arab Rep.El SalvadorEritreaEstoniaEthiopiaEuro areaEurope & Central AsiaEurope & Central Asia (excluding high income)Europe & Central Asia (IDA & IBRD countries)European UnionFinlandFragile and conflict affected situationsFranceGabonGeorgiaGermanyGhanaGibraltarGreeceGuatemalaHaitiHeavily indebted poor countries (HIPC)High incomeHondurasHong Kong SAR, ChinaHungaryIBRD onlyIcelandIDA & IBRD totalIDA blendIDA onlyIDA totalIndiaIndonesiaIran, Islamic Rep.IraqIrelandIsraelItalyJamaicaJapanJordanKazakhstanKenyaKorea, Dem. People’s Rep.Korea, Rep.KosovoKuwaitKyrgyz RepublicLate-demographic dividendLatin America & Caribbean Latin America & Caribbean (excluding high income)Latin America & the Caribbean (IDA & IBRD countries)LatviaLeast developed countries: UN classificationLebanonLibyaLithuaniaLow & middle incomeLow incomeLower middle incomeLuxembourgMacedonia, FYRMalaysiaMaltaMauritiusMexicoMiddle East & North AfricaMiddle East & North Africa (excluding high income)Middle East & North Africa (IDA & IBRD countries)Middle incomeMoldovaMongoliaMontenegroMoroccoMozambiqueMyanmarNamibiaNepalNetherlandsNew ZealandNicaraguaNigerNigeriaNorth AmericaNorwayOECD membersOmanOther small statesPakistanPanamaParaguayPeruPhilippinesPolandPortugalPost-demographic dividendPre-demographic dividendQatarRomaniaRussian FederationSaudi ArabiaSenegalSerbiaSingaporeSlovak RepublicSloveniaSmall statesSouth AfricaSouth AsiaSouth Asia (IDA & IBRD)South SudanSpainSri LankaSub-Saharan Africa Sub-Saharan Africa (excluding high income)Sub-Saharan Africa (IDA & IBRD countries)SudanSwedenSwitzerlandSyrian Arab RepublicTajikistanTanzaniaThailandTogoTrinidad and TobagoTunisiaTurkeyTurkmenistanUkraineUnited Arab EmiratesUnited KingdomUnited StatesUpper middle incomeUruguayUzbekistanVenezuela, RBVietnamWorldYemen, Rep.ZambiaZimbabwe Timeline:
This timeline shows a graph from 1961 to 2014 of Japan. No data until 1960. Number of actual observations by date: 54.
Source name:
World Development Indicators
Source organization:
IEA Statistics © OECD/IEA 2014 (http://www.iea.org/stats/index.asp), subject to https://www.iea.org/t&c/termsandconditions/
Categories, topics:
Energy & Mining, Infrastructure
Last updated:
apr 23, 2017
Indicators value changes by year
Maximum:
11.082
jan 1, 1961
At the date of observation
Value
Absolute change
Change from previous value
jan 1, 1961
11.082
+11.082
0.0%
jan 1, 1962
10.447
-0.636
-5.74%
jan 1, 1963
10.043
-0.404
-3.87%
jan 1, 1964
9.002
-1.041
-10.37%
jan 1, 1965
8.697
-0.305
-3.38%
jan 1, 1966
8.604
-0.093
-1.07%
jan 1, 1967
8.052
-0.552
-6.41%
jan 1, 1968
7.344
-0.709
-8.8%
jan 1, 1969
7.06
-0.283
-3.86%
jan 1, 1970
6.581
-0.479
-6.79%
jan 1, 1971
6.567
-0.014
-0.21%
jan 1, 1972
6.417
-0.15
-2.28%
jan 1, 1973
6.556
+0.139
2.16%
jan 1, 1974
6.046
-0.511
-7.79%
jan 1, 1975
4.826
-1.22
-20.17%
jan 1, 1976
5.216
+0.389
8.07%
jan 1, 1977
5.065
-0.151
-2.89%
jan 1, 1978
5.02
-0.045
-0.88%
jan 1, 1979
4.623
-0.397
-7.91%
jan 1, 1980
4.475
-0.148
-3.21%
jan 1, 1981
4.435
-0.04
-0.89%
jan 1, 1982
4.119
-0.316
-7.12%
jan 1, 1983
4.292
+0.173
4.19%
jan 1, 1984
4.31
+0.018
0.42%
jan 1, 1985
3.791
-0.518
-12.03%
jan 1, 1986
4.288
+0.497
13.11%
jan 1, 1987
4.333
+0.045
1.04%
jan 1, 1988
4.277
-0.056
-1.28%
jan 1, 1989
3.973
-0.304
-7.11%
jan 1, 1990
4.02
+0.047
1.17%
jan 1, 1991
4.879
+0.859
21.37%
jan 1, 1992
4.949
+0.07
1.43%
jan 1, 1993
4.928
-0.021
-0.42%
jan 1, 1994
4.855
-0.073
-1.47%
jan 1, 1995
4.75
-0.105
-2.17%
jan 1, 1996
4.742
-0.008
-0.17%
jan 1, 1997
4.535
-0.207
-4.37%
jan 1, 1998
4.733
+0.198
4.37%
jan 1, 1999
4.748
+0.015
0.31%
jan 1, 2000
4.613
-0.135
-2.84%
jan 1, 2001
4.476
-0.138
-2.98%
jan 1, 2002
4.402
-0.074
-1.65%
jan 1, 2003
4.729
+0.327
7.44%
jan 1, 2004
4.794
+0.065
1.38%
jan 1, 2005
4.574
-0.221
-4.61%
jan 1, 2006
4.627
+0.053
1.17%
jan 1, 2007
4.588
-0.039
-0.85%
jan 1, 2008
4.53
-0.057
-1.25%
jan 1, 2009
4.771
+0.241
5.31%
jan 1, 2010
4.842
+0.071
1.5%
jan 1, 2011
4.455
-0.388
-8.01%
jan 1, 2012
4.7
+0.245
5.5%
jan 1, 2013
4.422
-0.277
-5.9%
jan 1, 2014
4.576
+0.153
3.47%
Ranking of countries by current statistics by years


Comments: