29
/
en
AIzaSyAYiBZKx7MnpbEhh9jyipgxe19OcubqV5w
April 1, 2024
92484
Brunei Darussalam
BRN
true
2
1
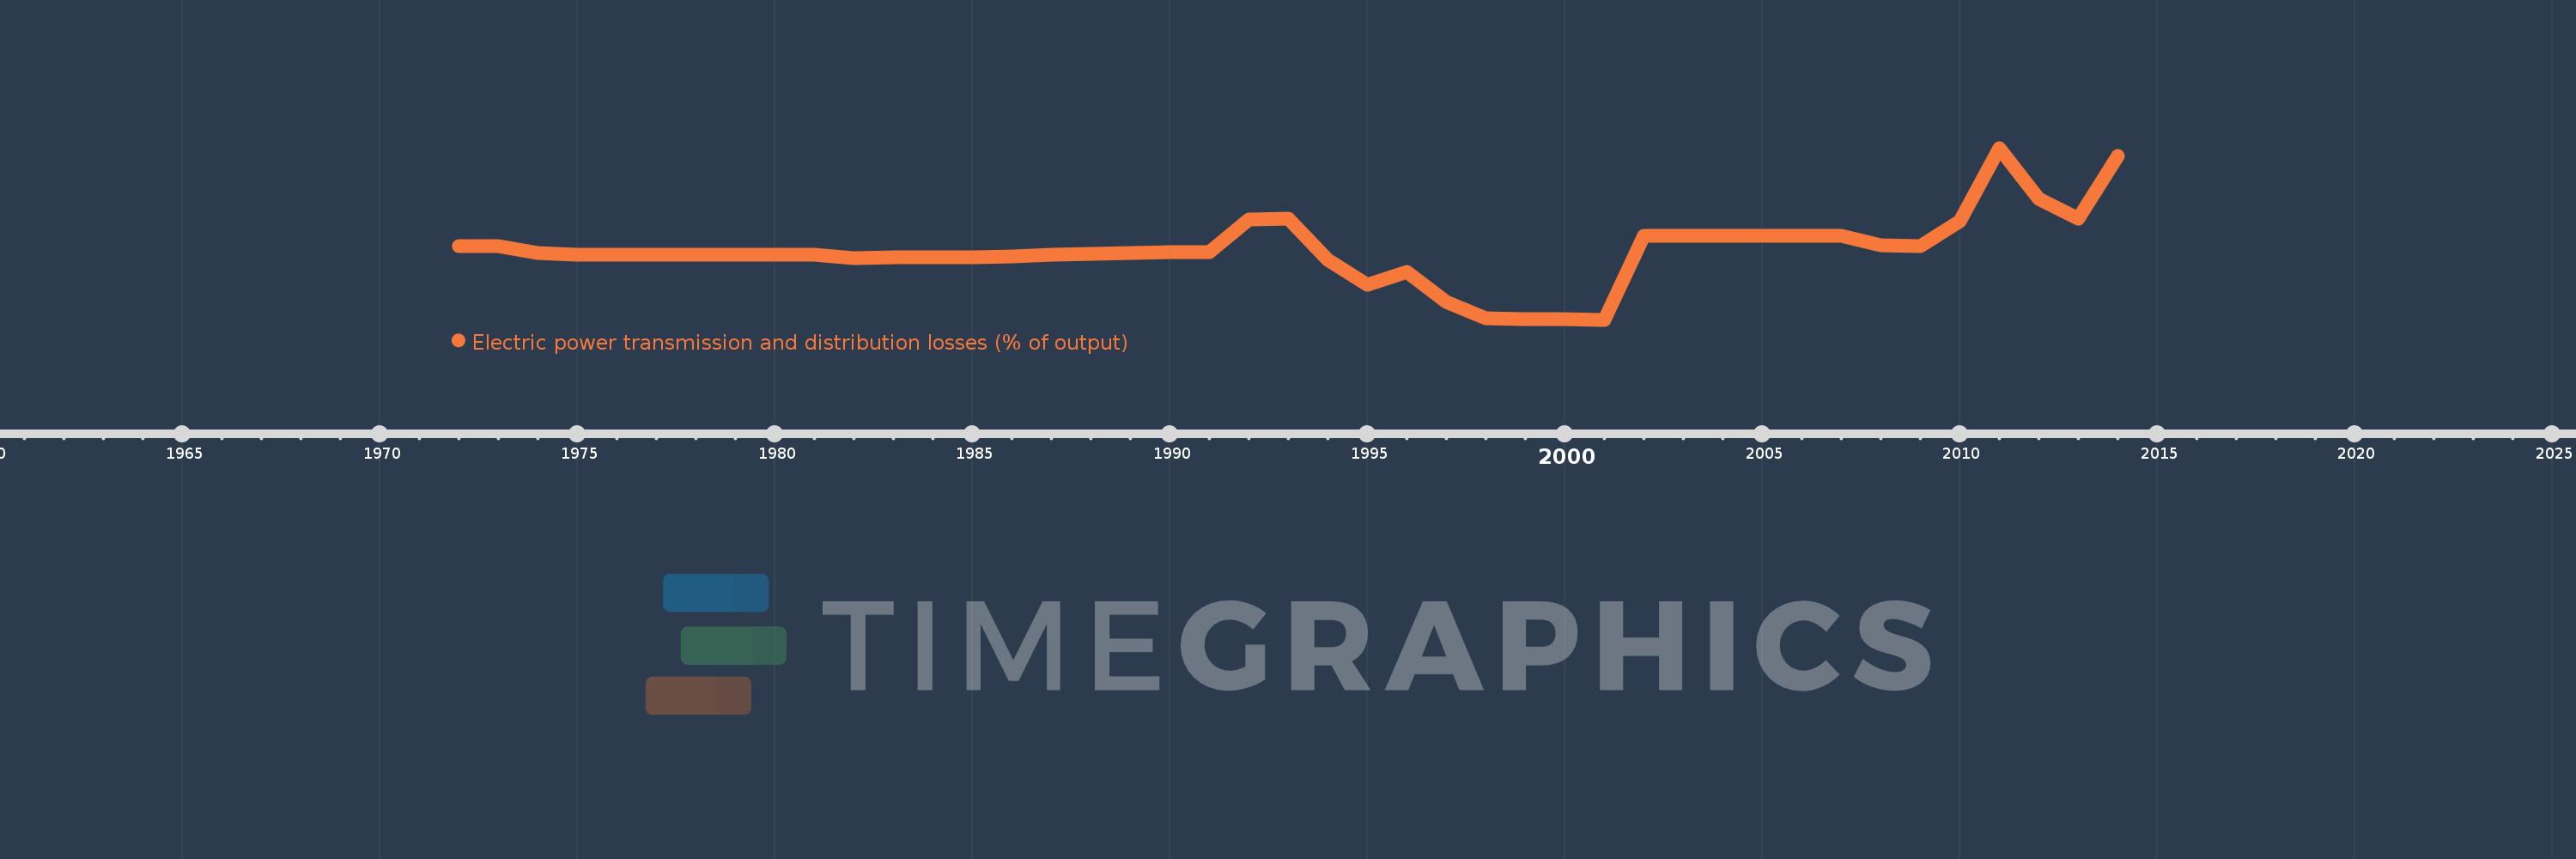
Electric power transmission and distribution losses (% of output)
2014,2013,2012,2011,2010,2009,2008,2007,2006,2005,2004,2003,2002,2001,2000,1999,1998,1997,1996,1995,1994,1993,1992,1991,1990,1989,1988,1987,1986,1985,1984,1983,1982,1981,1980,1979,1978,1977,1976,1975,1974,1973,1972
This statistics in other country:
AlbaniaAlgeriaAngolaArab WorldArgentinaArmeniaAustraliaAustriaAzerbaijanBahrainBangladeshBelarusBelgiumBeninBoliviaBosnia and HerzegovinaBotswanaBrazilBrunei DarussalamBulgariaCambodiaCameroonCanadaCaribbean small statesCentral Europe and the BalticsChileChinaColombiaCongo, Dem. Rep.Congo, Rep.Costa RicaCote d'IvoireCroatiaCubaCuracaoCyprusCzech RepublicDenmarkDominican RepublicEarly-demographic dividendEast Asia & PacificEast Asia & Pacific (excluding high income)East Asia & Pacific (IDA & IBRD countries)EcuadorEgypt, Arab Rep.El SalvadorEritreaEstoniaEthiopiaEuro areaEurope & Central AsiaEurope & Central Asia (excluding high income)Europe & Central Asia (IDA & IBRD countries)European UnionFinlandFragile and conflict affected situationsFranceGabonGeorgiaGermanyGhanaGibraltarGreeceGuatemalaHaitiHeavily indebted poor countries (HIPC)High incomeHondurasHong Kong SAR, ChinaHungaryIBRD onlyIcelandIDA & IBRD totalIDA blendIDA onlyIDA totalIndiaIndonesiaIran, Islamic Rep.IraqIrelandIsraelItalyJamaicaJapanJordanKazakhstanKenyaKorea, Dem. People’s Rep.Korea, Rep.KosovoKuwaitKyrgyz RepublicLate-demographic dividendLatin America & Caribbean Latin America & Caribbean (excluding high income)Latin America & the Caribbean (IDA & IBRD countries)LatviaLeast developed countries: UN classificationLebanonLibyaLithuaniaLow & middle incomeLow incomeLower middle incomeLuxembourgMacedonia, FYRMalaysiaMaltaMauritiusMexicoMiddle East & North AfricaMiddle East & North Africa (excluding high income)Middle East & North Africa (IDA & IBRD countries)Middle incomeMoldovaMongoliaMontenegroMoroccoMozambiqueMyanmarNamibiaNepalNetherlandsNew ZealandNicaraguaNigerNigeriaNorth AmericaNorwayOECD membersOmanOther small statesPakistanPanamaParaguayPeruPhilippinesPolandPortugalPost-demographic dividendPre-demographic dividendQatarRomaniaRussian FederationSaudi ArabiaSenegalSerbiaSingaporeSlovak RepublicSloveniaSmall statesSouth AfricaSouth AsiaSouth Asia (IDA & IBRD)South SudanSpainSri LankaSub-Saharan Africa Sub-Saharan Africa (excluding high income)Sub-Saharan Africa (IDA & IBRD countries)SudanSwedenSwitzerlandSyrian Arab RepublicTajikistanTanzaniaThailandTogoTrinidad and TobagoTunisiaTurkeyTurkmenistanUkraineUnited Arab EmiratesUnited KingdomUnited StatesUpper middle incomeUruguayUzbekistanVenezuela, RBVietnamWorldYemen, Rep.ZambiaZimbabwe Timeline:
This timeline shows a graph from 1972 to 2014 of Brunei Darussalam. No data until 1971. Number of actual observations by date: 43.
Source name:
World Development Indicators
Source organization:
IEA Statistics © OECD/IEA 2014 (http://www.iea.org/stats/index.asp), subject to https://www.iea.org/t&c/termsandconditions/
Categories, topics:
Energy & Mining, Infrastructure
Last updated:
apr 23, 2017
Indicators value changes by year
At the date of observation
Value
Absolute change
Change from previous value
jan 1, 1974
4.472
-0.328
-6.84%
jan 1, 1975
4.4
-0.072
-1.6%
jan 1, 1981
4.373
-0.027
-0.61%
jan 1, 1982
4.228
-0.145
-3.31%
jan 1, 1983
4.233
+0.004
0.11%
jan 1, 1984
4.252
+0.019
0.46%
jan 1, 1985
4.267
+0.014
0.34%
jan 1, 1986
4.308
+0.041
0.97%
jan 1, 1987
4.376
+0.068
1.57%
jan 1, 1988
4.415
+0.039
0.89%
jan 1, 1989
4.471
+0.056
1.27%
jan 1, 1990
4.505
+0.034
0.77%
jan 1, 1991
4.522
+0.017
0.37%
jan 1, 1992
6.147
+1.624
35.92%
jan 1, 1993
6.183
+0.037
0.6%
jan 1, 1994
4.134
-2.049
-33.14%
jan 1, 1995
2.886
-1.248
-30.19%
jan 1, 1996
3.51
+0.623
21.6%
jan 1, 1997
2.025
-1.484
-42.29%
jan 1, 1998
1.205
-0.821
-40.52%
jan 1, 1999
1.158
-0.047
-3.87%
jan 1, 2000
1.15
-0.008
-0.67%
jan 1, 2001
1.14
-0.01
-0.87%
jan 1, 2002
5.312
+4.172
365.82%
jan 1, 2003
5.331
+0.019
0.36%
jan 1, 2004
5.327
-0.004
-0.07%
jan 1, 2005
5.331
+0.003
0.06%
jan 1, 2006
5.331
0.0
0.0%
jan 1, 2007
5.337
+0.006
0.11%
jan 1, 2008
4.86
-0.476
-8.93%
jan 1, 2009
4.791
-0.069
-1.42%
jan 1, 2010
6.035
+1.244
25.97%
jan 1, 2011
9.705
+3.669
60.79%
jan 1, 2012
7.168
-2.537
-26.14%
jan 1, 2013
6.183
-0.985
-13.74%
jan 1, 2014
9.291
+3.108
50.27%
Ranking of countries by current statistics by years


Comments: