29
/
en
AIzaSyAYiBZKx7MnpbEhh9jyipgxe19OcubqV5w
April 1, 2024
30586
Europe & Central Asia
ECS
false
2
1
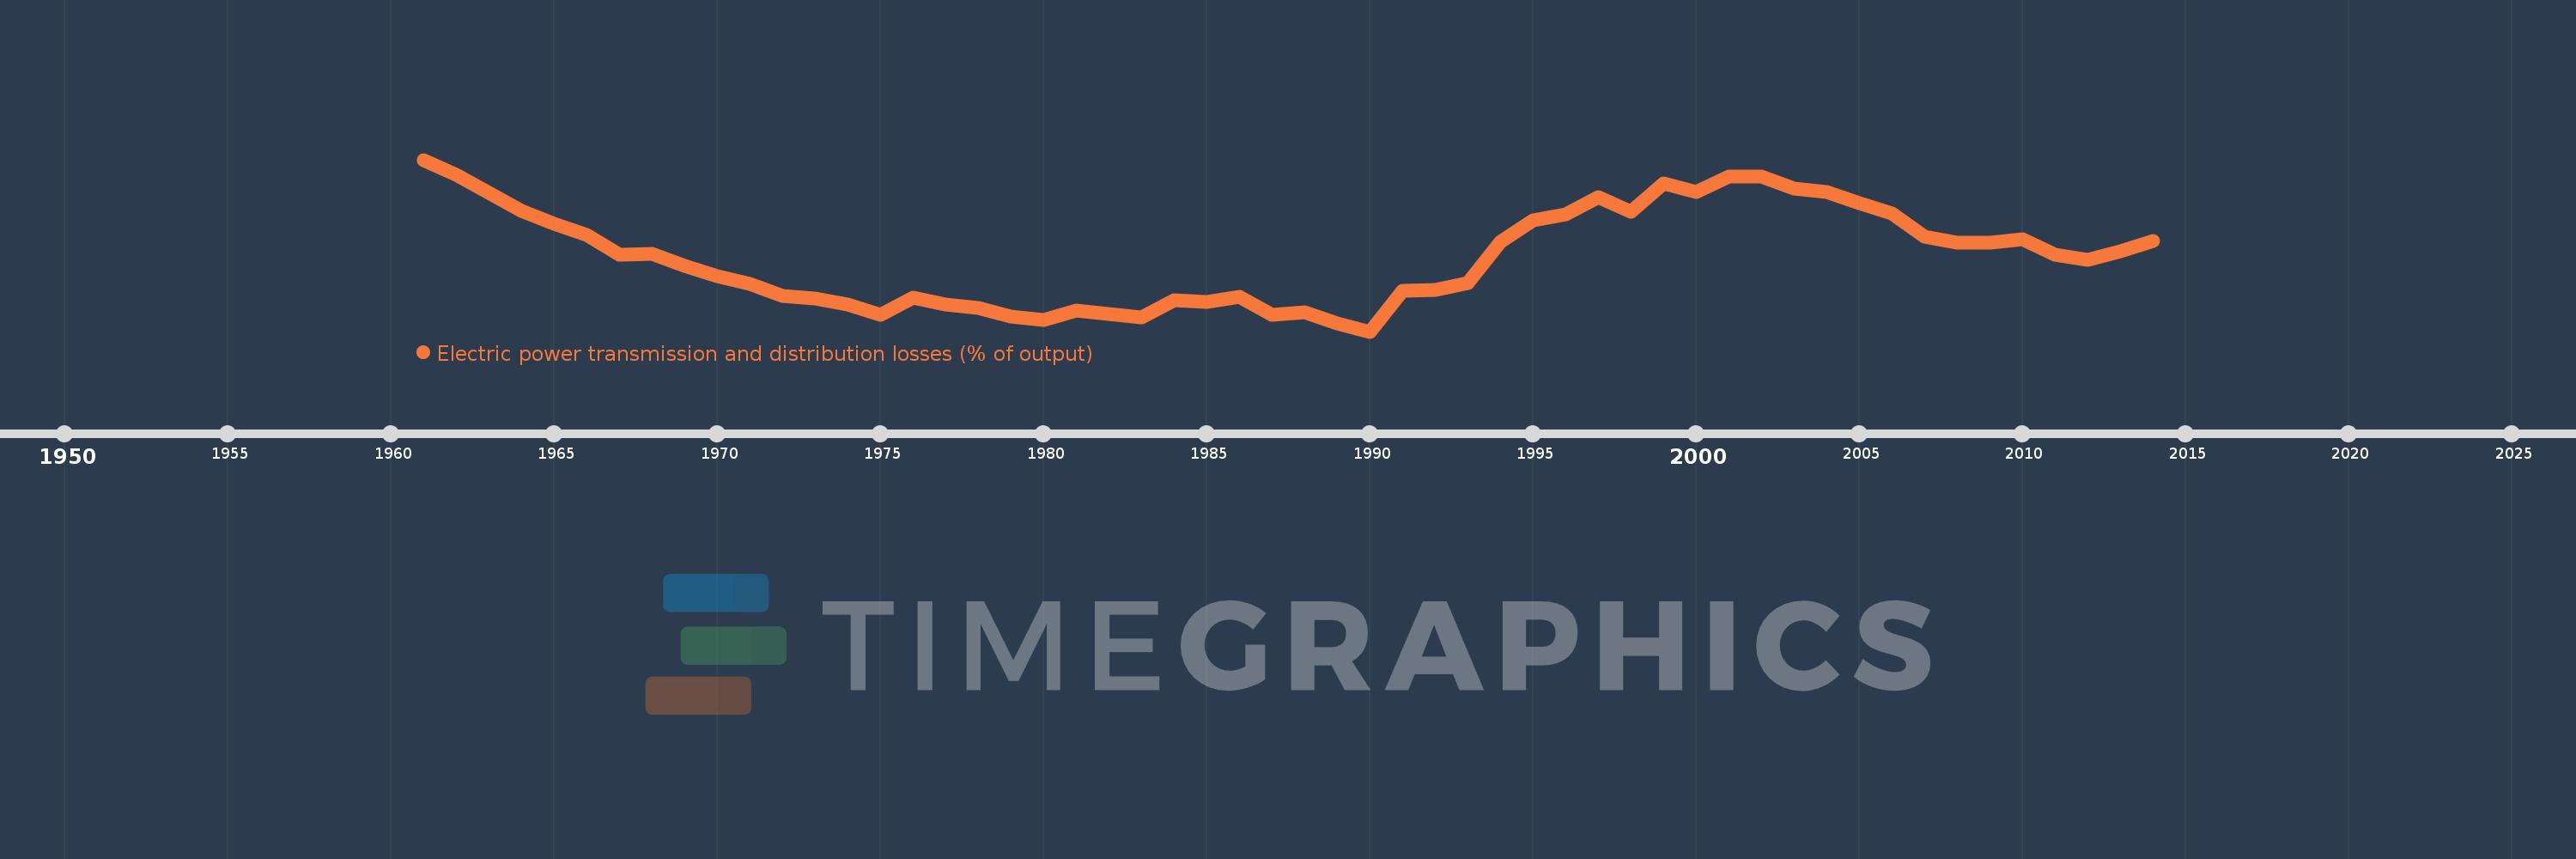
Electric power transmission and distribution losses (% of output)
2014,2013,2012,2011,2010,2009,2008,2007,2006,2005,2004,2003,2002,2001,2000,1999,1998,1997,1996,1995,1994,1993,1992,1991,1990,1989,1988,1987,1986,1985,1984,1983,1982,1981,1980,1979,1978,1977,1976,1975,1974,1973,1972,1971,1970,1969,1968,1967,1966,1965,1964,1963,1962,1961
This statistics in other country:
AlbaniaAlgeriaAngolaArab WorldArgentinaArmeniaAustraliaAustriaAzerbaijanBahrainBangladeshBelarusBelgiumBeninBoliviaBosnia and HerzegovinaBotswanaBrazilBrunei DarussalamBulgariaCambodiaCameroonCanadaCaribbean small statesCentral Europe and the BalticsChileChinaColombiaCongo, Dem. Rep.Congo, Rep.Costa RicaCote d'IvoireCroatiaCubaCuracaoCyprusCzech RepublicDenmarkDominican RepublicEarly-demographic dividendEast Asia & PacificEast Asia & Pacific (excluding high income)East Asia & Pacific (IDA & IBRD countries)EcuadorEgypt, Arab Rep.El SalvadorEritreaEstoniaEthiopiaEuro areaEurope & Central AsiaEurope & Central Asia (excluding high income)Europe & Central Asia (IDA & IBRD countries)European UnionFinlandFragile and conflict affected situationsFranceGabonGeorgiaGermanyGhanaGibraltarGreeceGuatemalaHaitiHeavily indebted poor countries (HIPC)High incomeHondurasHong Kong SAR, ChinaHungaryIBRD onlyIcelandIDA & IBRD totalIDA blendIDA onlyIDA totalIndiaIndonesiaIran, Islamic Rep.IraqIrelandIsraelItalyJamaicaJapanJordanKazakhstanKenyaKorea, Dem. People’s Rep.Korea, Rep.KosovoKuwaitKyrgyz RepublicLate-demographic dividendLatin America & Caribbean Latin America & Caribbean (excluding high income)Latin America & the Caribbean (IDA & IBRD countries)LatviaLeast developed countries: UN classificationLebanonLibyaLithuaniaLow & middle incomeLow incomeLower middle incomeLuxembourgMacedonia, FYRMalaysiaMaltaMauritiusMexicoMiddle East & North AfricaMiddle East & North Africa (excluding high income)Middle East & North Africa (IDA & IBRD countries)Middle incomeMoldovaMongoliaMontenegroMoroccoMozambiqueMyanmarNamibiaNepalNetherlandsNew ZealandNicaraguaNigerNigeriaNorth AmericaNorwayOECD membersOmanOther small statesPakistanPanamaParaguayPeruPhilippinesPolandPortugalPost-demographic dividendPre-demographic dividendQatarRomaniaRussian FederationSaudi ArabiaSenegalSerbiaSingaporeSlovak RepublicSloveniaSmall statesSouth AfricaSouth AsiaSouth Asia (IDA & IBRD)South SudanSpainSri LankaSub-Saharan Africa Sub-Saharan Africa (excluding high income)Sub-Saharan Africa (IDA & IBRD countries)SudanSwedenSwitzerlandSyrian Arab RepublicTajikistanTanzaniaThailandTogoTrinidad and TobagoTunisiaTurkeyTurkmenistanUkraineUnited Arab EmiratesUnited KingdomUnited StatesUpper middle incomeUruguayUzbekistanVenezuela, RBVietnamWorldYemen, Rep.ZambiaZimbabwe Timeline:
This timeline shows a graph from 1961 to 2014 of Europe & Central Asia. No data until 1960. Number of actual observations by date: 54.
Source name:
World Development Indicators
Source organization:
IEA Statistics © OECD/IEA 2014 (http://www.iea.org/stats/index.asp), subject to https://www.iea.org/t&c/termsandconditions/
Categories, topics:
Energy & Mining, Infrastructure
Last updated:
apr 23, 2017
Indicators value changes by year
At the date of observation
Value
Absolute change
Change from previous value
jan 1, 1961
9.463
+9.463
0.0%
jan 1, 1962
9.227
-0.236
-2.49%
jan 1, 1963
8.947
-0.28
-3.03%
jan 1, 1964
8.659
-0.289
-3.22%
jan 1, 1965
8.451
-0.208
-2.4%
jan 1, 1966
8.286
-0.165
-1.95%
jan 1, 1967
7.969
-0.317
-3.83%
jan 1, 1968
7.984
+0.016
0.2%
jan 1, 1969
7.792
-0.192
-2.4%
jan 1, 1970
7.638
-0.155
-1.98%
jan 1, 1971
7.505
-0.133
-1.74%
jan 1, 1972
7.319
-0.186
-2.48%
jan 1, 1973
7.277
-0.042
-0.57%
jan 1, 1974
7.193
-0.085
-1.16%
jan 1, 1975
7.029
-0.163
-2.27%
jan 1, 1976
7.292
+0.263
3.74%
jan 1, 1977
7.183
-0.109
-1.5%
jan 1, 1978
7.135
-0.048
-0.67%
jan 1, 1979
6.998
-0.136
-1.91%
jan 1, 1980
6.946
-0.053
-0.75%
jan 1, 1981
7.089
+0.143
2.06%
jan 1, 1982
7.036
-0.052
-0.74%
jan 1, 1983
6.986
-0.051
-0.72%
jan 1, 1984
7.259
+0.273
3.91%
jan 1, 1985
7.227
-0.032
-0.44%
jan 1, 1986
7.314
+0.088
1.21%
jan 1, 1987
7.028
-0.286
-3.91%
jan 1, 1988
7.065
+0.036
0.52%
jan 1, 1989
6.89
-0.175
-2.48%
jan 1, 1990
6.761
-0.129
-1.87%
jan 1, 1991
7.4
+0.639
9.46%
jan 1, 1992
7.414
+0.014
0.18%
jan 1, 1993
7.522
+0.108
1.46%
jan 1, 1994
8.173
+0.651
8.65%
jan 1, 1995
8.513
+0.34
4.15%
jan 1, 1996
8.61
+0.097
1.14%
jan 1, 1997
8.876
+0.266
3.09%
jan 1, 1998
8.646
-0.23
-2.59%
jan 1, 1999
9.085
+0.439
5.08%
jan 1, 2000
8.953
-0.132
-1.45%
jan 1, 2001
9.198
+0.245
2.74%
jan 1, 2002
9.195
-0.003
-0.04%
jan 1, 2003
9.006
-0.188
-2.05%
jan 1, 2004
8.958
-0.048
-0.54%
jan 1, 2005
8.785
-0.173
-1.93%
jan 1, 2006
8.619
-0.166
-1.89%
jan 1, 2007
8.256
-0.362
-4.21%
jan 1, 2008
8.153
-0.103
-1.25%
jan 1, 2009
8.166
+0.013
0.16%
jan 1, 2010
8.22
+0.054
0.66%
jan 1, 2011
7.971
-0.25
-3.04%
jan 1, 2012
7.885
-0.086
-1.08%
jan 1, 2013
8.025
+0.14
1.78%
jan 1, 2014
8.184
+0.159
1.98%
Ranking of countries by current statistics by years


Comments: