29
/
en
AIzaSyAYiBZKx7MnpbEhh9jyipgxe19OcubqV5w
April 1, 2024
54690
Post-demographic dividend
PST
false
2
1
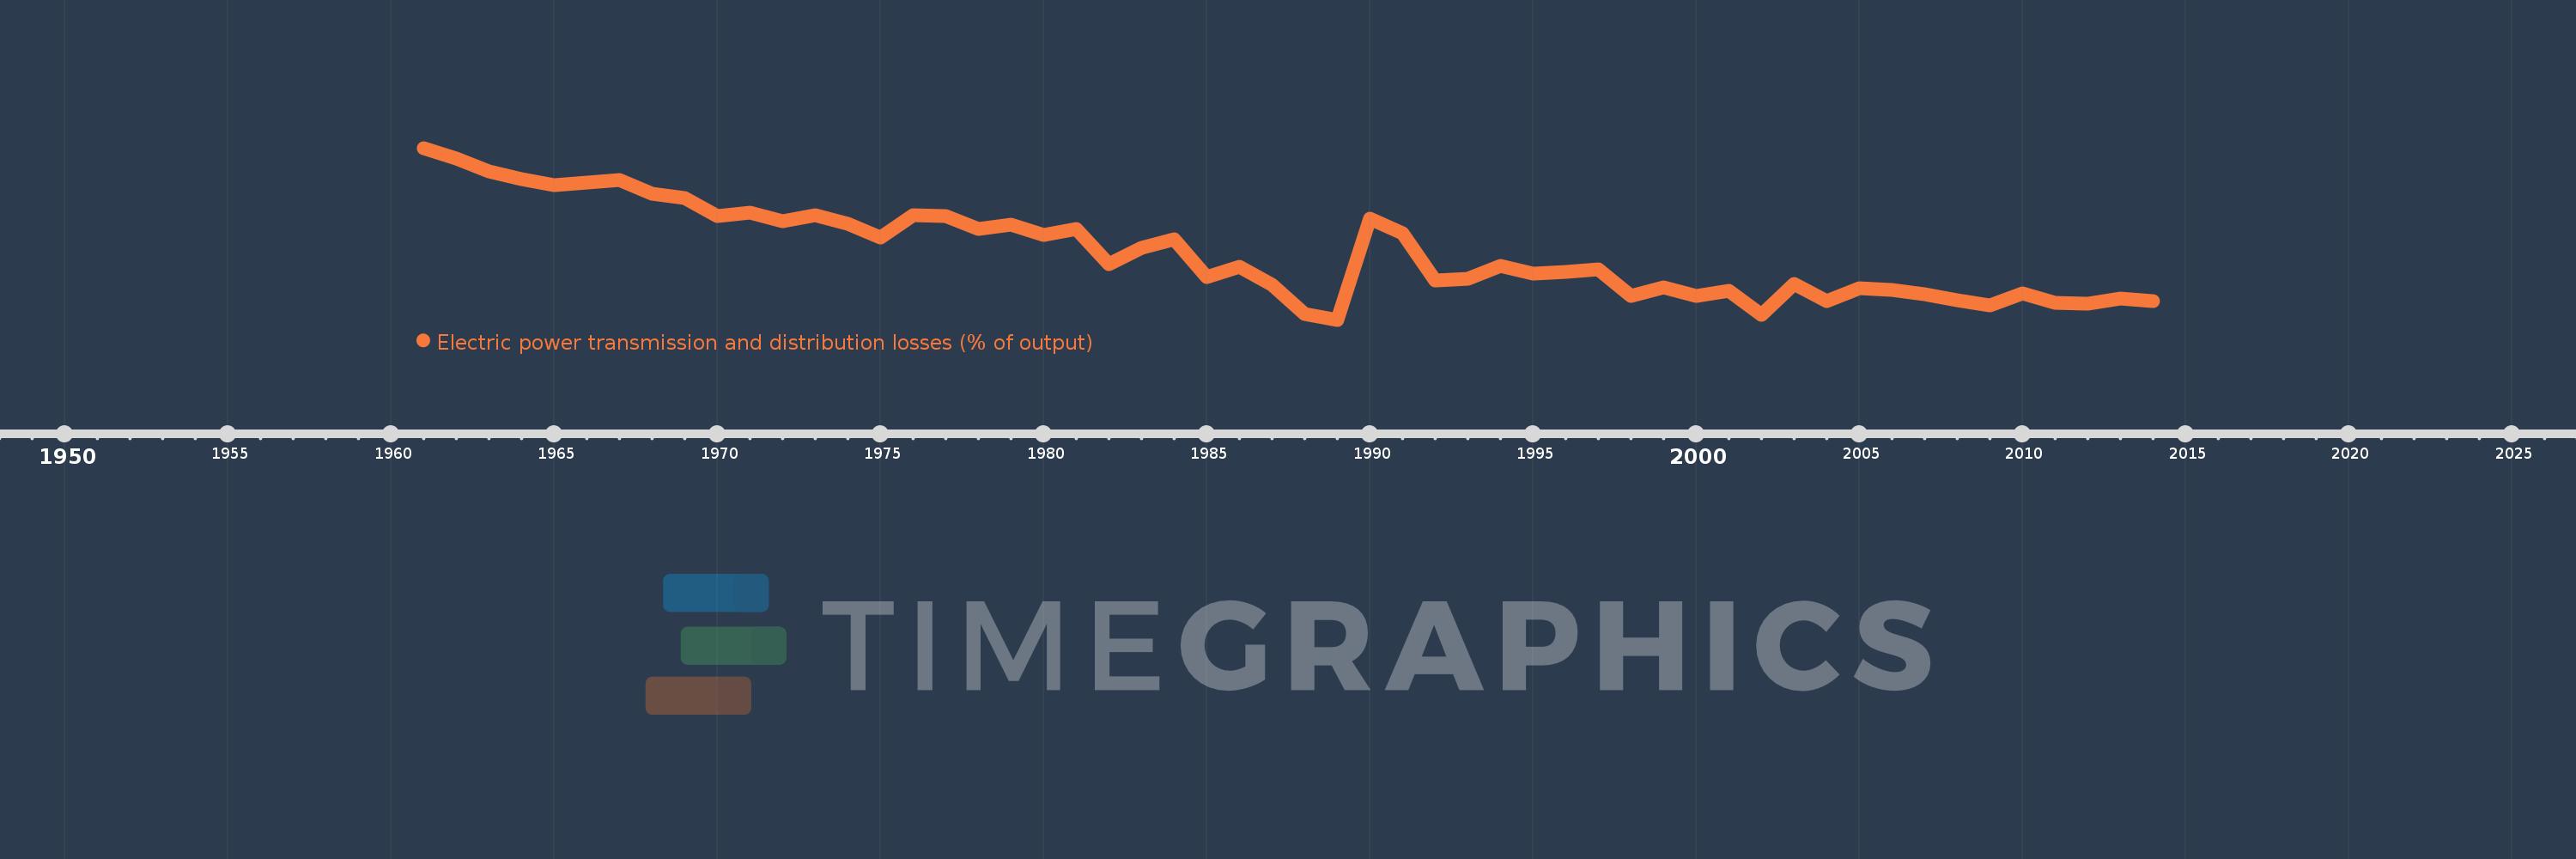
Electric power transmission and distribution losses (% of output)
2014,2013,2012,2011,2010,2009,2008,2007,2006,2005,2004,2003,2002,2001,2000,1999,1998,1997,1996,1995,1994,1993,1992,1991,1990,1989,1988,1987,1986,1985,1984,1983,1982,1981,1980,1979,1978,1977,1976,1975,1974,1973,1972,1971,1970,1969,1968,1967,1966,1965,1964,1963,1962,1961
This statistics in other country:
AlbaniaAlgeriaAngolaArab WorldArgentinaArmeniaAustraliaAustriaAzerbaijanBahrainBangladeshBelarusBelgiumBeninBoliviaBosnia and HerzegovinaBotswanaBrazilBrunei DarussalamBulgariaCambodiaCameroonCanadaCaribbean small statesCentral Europe and the BalticsChileChinaColombiaCongo, Dem. Rep.Congo, Rep.Costa RicaCote d'IvoireCroatiaCubaCuracaoCyprusCzech RepublicDenmarkDominican RepublicEarly-demographic dividendEast Asia & PacificEast Asia & Pacific (excluding high income)East Asia & Pacific (IDA & IBRD countries)EcuadorEgypt, Arab Rep.El SalvadorEritreaEstoniaEthiopiaEuro areaEurope & Central AsiaEurope & Central Asia (excluding high income)Europe & Central Asia (IDA & IBRD countries)European UnionFinlandFragile and conflict affected situationsFranceGabonGeorgiaGermanyGhanaGibraltarGreeceGuatemalaHaitiHeavily indebted poor countries (HIPC)High incomeHondurasHong Kong SAR, ChinaHungaryIBRD onlyIcelandIDA & IBRD totalIDA blendIDA onlyIDA totalIndiaIndonesiaIran, Islamic Rep.IraqIrelandIsraelItalyJamaicaJapanJordanKazakhstanKenyaKorea, Dem. People’s Rep.Korea, Rep.KosovoKuwaitKyrgyz RepublicLate-demographic dividendLatin America & Caribbean Latin America & Caribbean (excluding high income)Latin America & the Caribbean (IDA & IBRD countries)LatviaLeast developed countries: UN classificationLebanonLibyaLithuaniaLow & middle incomeLow incomeLower middle incomeLuxembourgMacedonia, FYRMalaysiaMaltaMauritiusMexicoMiddle East & North AfricaMiddle East & North Africa (excluding high income)Middle East & North Africa (IDA & IBRD countries)Middle incomeMoldovaMongoliaMontenegroMoroccoMozambiqueMyanmarNamibiaNepalNetherlandsNew ZealandNicaraguaNigerNigeriaNorth AmericaNorwayOECD membersOmanOther small statesPakistanPanamaParaguayPeruPhilippinesPolandPortugalPost-demographic dividendPre-demographic dividendQatarRomaniaRussian FederationSaudi ArabiaSenegalSerbiaSingaporeSlovak RepublicSloveniaSmall statesSouth AfricaSouth AsiaSouth Asia (IDA & IBRD)South SudanSpainSri LankaSub-Saharan Africa Sub-Saharan Africa (excluding high income)Sub-Saharan Africa (IDA & IBRD countries)SudanSwedenSwitzerlandSyrian Arab RepublicTajikistanTanzaniaThailandTogoTrinidad and TobagoTunisiaTurkeyTurkmenistanUkraineUnited Arab EmiratesUnited KingdomUnited StatesUpper middle incomeUruguayUzbekistanVenezuela, RBVietnamWorldYemen, Rep.ZambiaZimbabwe Timeline:
This timeline shows a graph from 1961 to 2014 of Post-demographic dividend. No data until 1960. Number of actual observations by date: 54.
Source name:
World Development Indicators
Source organization:
IEA Statistics © OECD/IEA 2014 (http://www.iea.org/stats/index.asp), subject to https://www.iea.org/t&c/termsandconditions/
Categories, topics:
Energy & Mining, Infrastructure
Last updated:
apr 23, 2017
Indicators value changes by year
At the date of observation
Value
Absolute change
Change from previous value
jan 1, 1961
9.393
+9.393
0.0%
jan 1, 1962
9.163
-0.23
-2.44%
jan 1, 1963
8.892
-0.271
-2.96%
jan 1, 1964
8.728
-0.164
-1.84%
jan 1, 1965
8.605
-0.123
-1.41%
jan 1, 1966
8.66
+0.055
0.64%
jan 1, 1967
8.719
+0.058
0.67%
jan 1, 1968
8.429
-0.289
-3.32%
jan 1, 1969
8.331
-0.099
-1.17%
jan 1, 1970
7.958
-0.373
-4.48%
jan 1, 1971
8.017
+0.059
0.74%
jan 1, 1972
7.834
-0.182
-2.28%
jan 1, 1973
7.96
+0.126
1.61%
jan 1, 1974
7.789
-0.171
-2.15%
jan 1, 1975
7.49
-0.299
-3.84%
jan 1, 1976
7.966
+0.476
6.36%
jan 1, 1977
7.955
-0.011
-0.14%
jan 1, 1978
7.674
-0.282
-3.54%
jan 1, 1979
7.769
+0.095
1.24%
jan 1, 1980
7.549
-0.22
-2.83%
jan 1, 1981
7.669
+0.12
1.59%
jan 1, 1982
6.937
-0.733
-9.55%
jan 1, 1983
7.267
+0.33
4.76%
jan 1, 1984
7.458
+0.191
2.63%
jan 1, 1985
6.661
-0.797
-10.69%
jan 1, 1986
6.884
+0.222
3.34%
jan 1, 1987
6.485
-0.399
-5.79%
jan 1, 1988
5.881
-0.604
-9.32%
jan 1, 1989
5.752
-0.129
-2.19%
jan 1, 1990
7.902
+2.15
37.38%
jan 1, 1991
7.584
-0.318
-4.02%
jan 1, 1992
6.58
-1.004
-13.24%
jan 1, 1993
6.621
+0.042
0.63%
jan 1, 1994
6.892
+0.27
4.08%
jan 1, 1995
6.728
-0.164
-2.38%
jan 1, 1996
6.771
+0.044
0.65%
jan 1, 1997
6.825
+0.053
0.78%
jan 1, 1998
6.264
-0.561
-8.22%
jan 1, 1999
6.433
+0.169
2.7%
jan 1, 2000
6.259
-0.174
-2.7%
jan 1, 2001
6.374
+0.115
1.84%
jan 1, 2002
5.85
-0.524
-8.22%
jan 1, 2003
6.513
+0.663
11.34%
jan 1, 2004
6.14
-0.373
-5.73%
jan 1, 2005
6.412
+0.273
4.44%
jan 1, 2006
6.392
-0.021
-0.32%
jan 1, 2007
6.285
-0.107
-1.67%
jan 1, 2008
6.158
-0.126
-2.01%
jan 1, 2009
6.049
-0.109
-1.78%
jan 1, 2010
6.31
+0.262
4.33%
jan 1, 2011
6.105
-0.206
-3.26%
jan 1, 2012
6.098
-0.007
-0.11%
jan 1, 2013
6.201
+0.103
1.7%
jan 1, 2014
6.138
-0.064
-1.03%
Ranking of countries by current statistics by years


Comments: