29
/
en
AIzaSyAYiBZKx7MnpbEhh9jyipgxe19OcubqV5w
April 1, 2024
33337
European Union
EUU
false
2
1
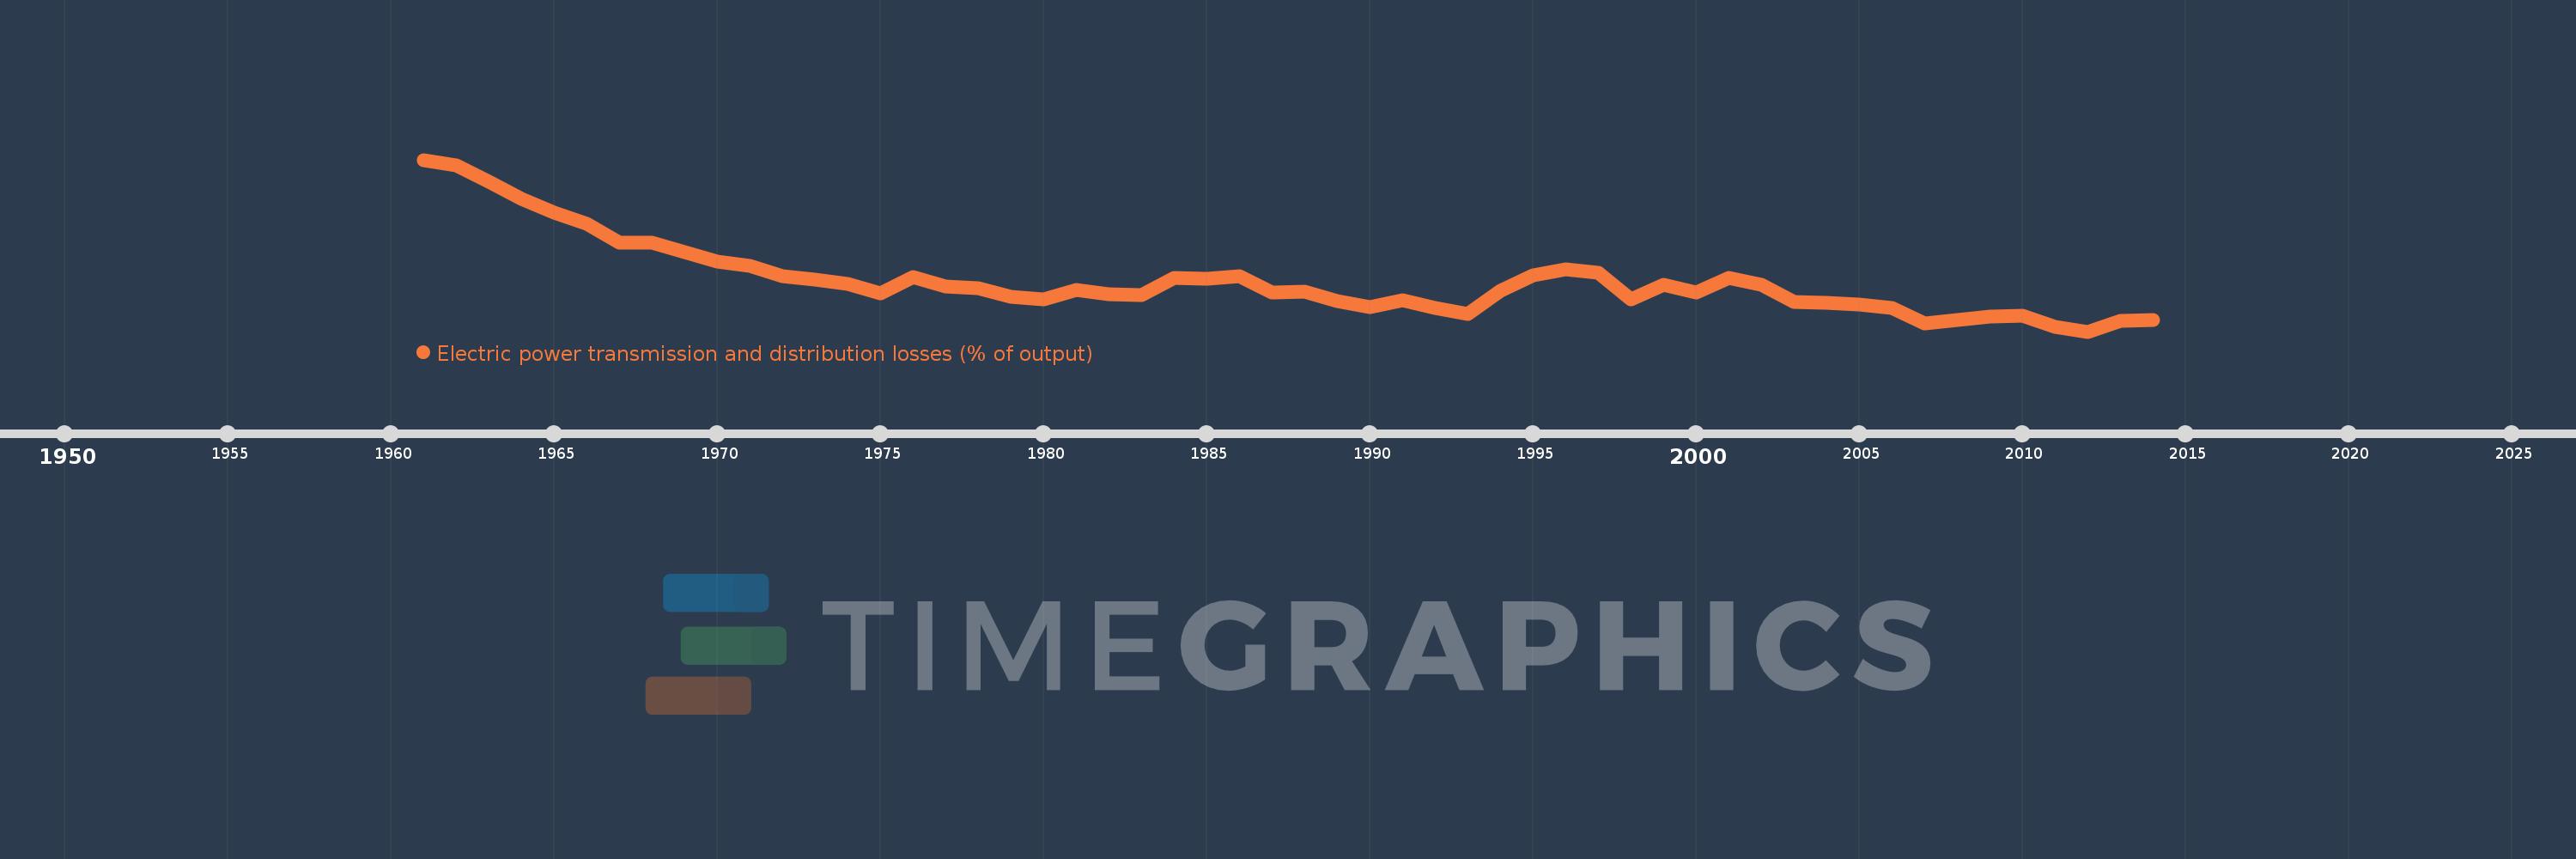
Electric power transmission and distribution losses (% of output)
2014,2013,2012,2011,2010,2009,2008,2007,2006,2005,2004,2003,2002,2001,2000,1999,1998,1997,1996,1995,1994,1993,1992,1991,1990,1989,1988,1987,1986,1985,1984,1983,1982,1981,1980,1979,1978,1977,1976,1975,1974,1973,1972,1971,1970,1969,1968,1967,1966,1965,1964,1963,1962,1961
This statistics in other country:
AlbaniaAlgeriaAngolaArab WorldArgentinaArmeniaAustraliaAustriaAzerbaijanBahrainBangladeshBelarusBelgiumBeninBoliviaBosnia and HerzegovinaBotswanaBrazilBrunei DarussalamBulgariaCambodiaCameroonCanadaCaribbean small statesCentral Europe and the BalticsChileChinaColombiaCongo, Dem. Rep.Congo, Rep.Costa RicaCote d'IvoireCroatiaCubaCuracaoCyprusCzech RepublicDenmarkDominican RepublicEarly-demographic dividendEast Asia & PacificEast Asia & Pacific (excluding high income)East Asia & Pacific (IDA & IBRD countries)EcuadorEgypt, Arab Rep.El SalvadorEritreaEstoniaEthiopiaEuro areaEurope & Central AsiaEurope & Central Asia (excluding high income)Europe & Central Asia (IDA & IBRD countries)European UnionFinlandFragile and conflict affected situationsFranceGabonGeorgiaGermanyGhanaGibraltarGreeceGuatemalaHaitiHeavily indebted poor countries (HIPC)High incomeHondurasHong Kong SAR, ChinaHungaryIBRD onlyIcelandIDA & IBRD totalIDA blendIDA onlyIDA totalIndiaIndonesiaIran, Islamic Rep.IraqIrelandIsraelItalyJamaicaJapanJordanKazakhstanKenyaKorea, Dem. People’s Rep.Korea, Rep.KosovoKuwaitKyrgyz RepublicLate-demographic dividendLatin America & Caribbean Latin America & Caribbean (excluding high income)Latin America & the Caribbean (IDA & IBRD countries)LatviaLeast developed countries: UN classificationLebanonLibyaLithuaniaLow & middle incomeLow incomeLower middle incomeLuxembourgMacedonia, FYRMalaysiaMaltaMauritiusMexicoMiddle East & North AfricaMiddle East & North Africa (excluding high income)Middle East & North Africa (IDA & IBRD countries)Middle incomeMoldovaMongoliaMontenegroMoroccoMozambiqueMyanmarNamibiaNepalNetherlandsNew ZealandNicaraguaNigerNigeriaNorth AmericaNorwayOECD membersOmanOther small statesPakistanPanamaParaguayPeruPhilippinesPolandPortugalPost-demographic dividendPre-demographic dividendQatarRomaniaRussian FederationSaudi ArabiaSenegalSerbiaSingaporeSlovak RepublicSloveniaSmall statesSouth AfricaSouth AsiaSouth Asia (IDA & IBRD)South SudanSpainSri LankaSub-Saharan Africa Sub-Saharan Africa (excluding high income)Sub-Saharan Africa (IDA & IBRD countries)SudanSwedenSwitzerlandSyrian Arab RepublicTajikistanTanzaniaThailandTogoTrinidad and TobagoTunisiaTurkeyTurkmenistanUkraineUnited Arab EmiratesUnited KingdomUnited StatesUpper middle incomeUruguayUzbekistanVenezuela, RBVietnamWorldYemen, Rep.ZambiaZimbabwe Timeline:
This timeline shows a graph from 1961 to 2014 of European Union. No data until 1960. Number of actual observations by date: 54.
Source name:
World Development Indicators
Source organization:
IEA Statistics © OECD/IEA 2014 (http://www.iea.org/stats/index.asp), subject to https://www.iea.org/t&c/termsandconditions/
Categories, topics:
Energy & Mining, Infrastructure
Last updated:
apr 23, 2017
Indicators value changes by year
At the date of observation
Value
Absolute change
Change from previous value
jan 1, 1961
9.246
+9.246
0.0%
jan 1, 1962
9.152
-0.094
-1.01%
jan 1, 1963
8.868
-0.284
-3.1%
jan 1, 1964
8.561
-0.307
-3.46%
jan 1, 1965
8.331
-0.23
-2.69%
jan 1, 1966
8.132
-0.199
-2.38%
jan 1, 1967
7.807
-0.325
-4.0%
jan 1, 1968
7.809
+0.002
0.03%
jan 1, 1969
7.631
-0.178
-2.28%
jan 1, 1970
7.479
-0.153
-2.0%
jan 1, 1971
7.393
-0.086
-1.14%
jan 1, 1972
7.212
-0.181
-2.44%
jan 1, 1973
7.157
-0.055
-0.77%
jan 1, 1974
7.081
-0.076
-1.06%
jan 1, 1975
6.912
-0.169
-2.39%
jan 1, 1976
7.206
+0.294
4.25%
jan 1, 1977
7.044
-0.162
-2.25%
jan 1, 1978
7.016
-0.027
-0.39%
jan 1, 1979
6.864
-0.152
-2.17%
jan 1, 1980
6.818
-0.046
-0.67%
jan 1, 1981
6.981
+0.162
2.38%
jan 1, 1982
6.899
-0.082
-1.17%
jan 1, 1983
6.887
-0.012
-0.18%
jan 1, 1984
7.186
+0.3
4.35%
jan 1, 1985
7.176
-0.01
-0.14%
jan 1, 1986
7.211
+0.035
0.48%
jan 1, 1987
6.936
-0.275
-3.81%
jan 1, 1988
6.943
+0.006
0.09%
jan 1, 1989
6.786
-0.157
-2.26%
jan 1, 1990
6.679
-0.106
-1.57%
jan 1, 1991
6.805
+0.126
1.89%
jan 1, 1992
6.662
-0.143
-2.1%
jan 1, 1993
6.557
-0.106
-1.59%
jan 1, 1994
6.962
+0.405
6.18%
jan 1, 1995
7.228
+0.265
3.81%
jan 1, 1996
7.343
+0.116
1.6%
jan 1, 1997
7.279
-0.065
-0.88%
jan 1, 1998
6.808
-0.471
-6.46%
jan 1, 1999
7.076
+0.267
3.93%
jan 1, 2000
6.937
-0.139
-1.96%
jan 1, 2001
7.195
+0.258
3.73%
jan 1, 2002
7.075
-0.12
-1.67%
jan 1, 2003
6.769
-0.306
-4.33%
jan 1, 2004
6.761
-0.008
-0.12%
jan 1, 2005
6.726
-0.035
-0.52%
jan 1, 2006
6.663
-0.063
-0.93%
jan 1, 2007
6.396
-0.267
-4.0%
jan 1, 2008
6.455
+0.059
0.92%
jan 1, 2009
6.508
+0.054
0.83%
jan 1, 2010
6.523
+0.015
0.23%
jan 1, 2011
6.329
-0.195
-2.98%
jan 1, 2012
6.253
-0.076
-1.2%
jan 1, 2013
6.437
+0.184
2.94%
jan 1, 2014
6.448
+0.011
0.16%
Ranking of countries by current statistics by years


Comments: