29
/
en
AIzaSyAYiBZKx7MnpbEhh9jyipgxe19OcubqV5w
April 1, 2024
260768
Tanzania
TZA
true
2
1
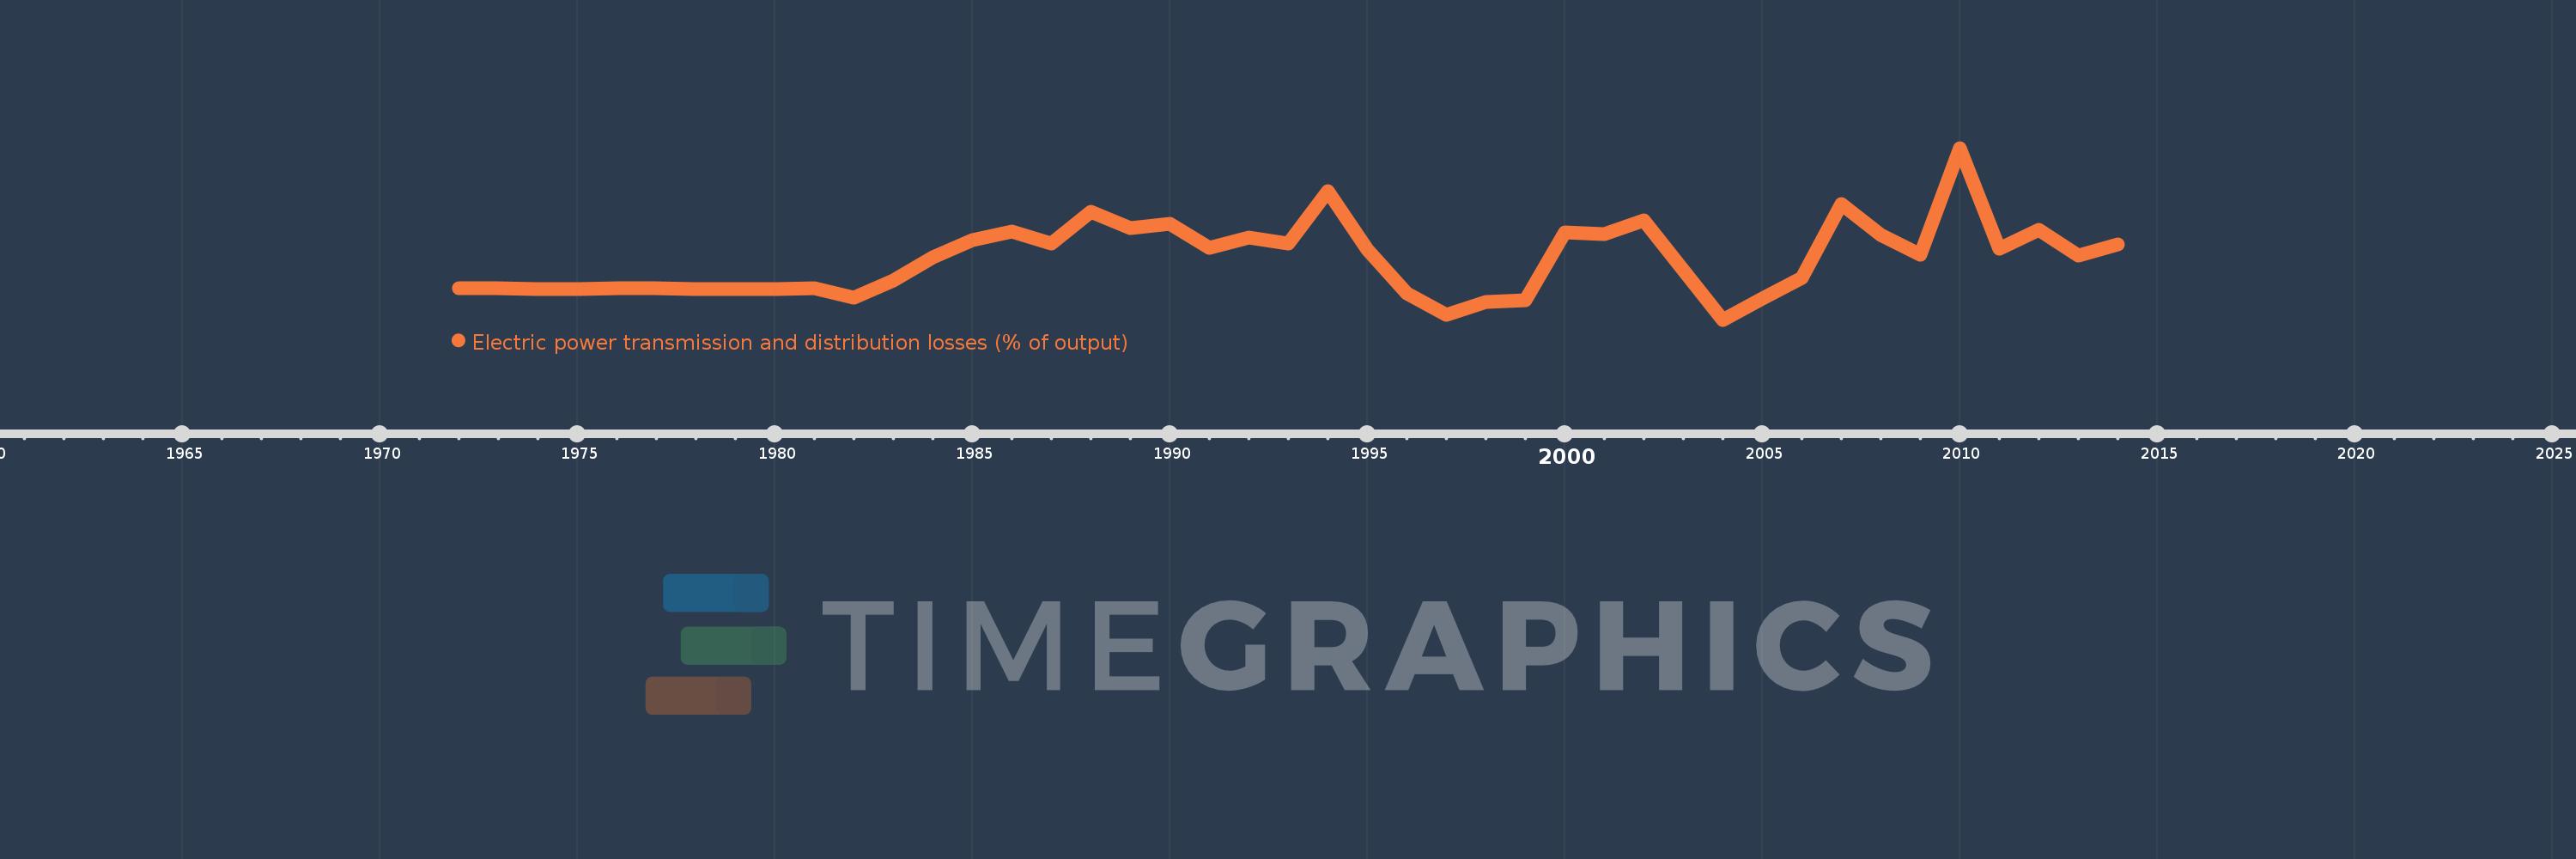
Electric power transmission and distribution losses (% of output)
2014,2013,2012,2011,2010,2009,2008,2007,2006,2005,2004,2003,2002,2001,2000,1999,1998,1997,1996,1995,1994,1993,1992,1991,1990,1989,1988,1987,1986,1985,1984,1983,1982,1981,1980,1979,1978,1977,1976,1975,1974,1973,1972
This statistics in other country:
AlbaniaAlgeriaAngolaArab WorldArgentinaArmeniaAustraliaAustriaAzerbaijanBahrainBangladeshBelarusBelgiumBeninBoliviaBosnia and HerzegovinaBotswanaBrazilBrunei DarussalamBulgariaCambodiaCameroonCanadaCaribbean small statesCentral Europe and the BalticsChileChinaColombiaCongo, Dem. Rep.Congo, Rep.Costa RicaCote d'IvoireCroatiaCubaCuracaoCyprusCzech RepublicDenmarkDominican RepublicEarly-demographic dividendEast Asia & PacificEast Asia & Pacific (excluding high income)East Asia & Pacific (IDA & IBRD countries)EcuadorEgypt, Arab Rep.El SalvadorEritreaEstoniaEthiopiaEuro areaEurope & Central AsiaEurope & Central Asia (excluding high income)Europe & Central Asia (IDA & IBRD countries)European UnionFinlandFragile and conflict affected situationsFranceGabonGeorgiaGermanyGhanaGibraltarGreeceGuatemalaHaitiHeavily indebted poor countries (HIPC)High incomeHondurasHong Kong SAR, ChinaHungaryIBRD onlyIcelandIDA & IBRD totalIDA blendIDA onlyIDA totalIndiaIndonesiaIran, Islamic Rep.IraqIrelandIsraelItalyJamaicaJapanJordanKazakhstanKenyaKorea, Dem. People’s Rep.Korea, Rep.KosovoKuwaitKyrgyz RepublicLate-demographic dividendLatin America & Caribbean Latin America & Caribbean (excluding high income)Latin America & the Caribbean (IDA & IBRD countries)LatviaLeast developed countries: UN classificationLebanonLibyaLithuaniaLow & middle incomeLow incomeLower middle incomeLuxembourgMacedonia, FYRMalaysiaMaltaMauritiusMexicoMiddle East & North AfricaMiddle East & North Africa (excluding high income)Middle East & North Africa (IDA & IBRD countries)Middle incomeMoldovaMongoliaMontenegroMoroccoMozambiqueMyanmarNamibiaNepalNetherlandsNew ZealandNicaraguaNigerNigeriaNorth AmericaNorwayOECD membersOmanOther small statesPakistanPanamaParaguayPeruPhilippinesPolandPortugalPost-demographic dividendPre-demographic dividendQatarRomaniaRussian FederationSaudi ArabiaSenegalSerbiaSingaporeSlovak RepublicSloveniaSmall statesSouth AfricaSouth AsiaSouth Asia (IDA & IBRD)South SudanSpainSri LankaSub-Saharan Africa Sub-Saharan Africa (excluding high income)Sub-Saharan Africa (IDA & IBRD countries)SudanSwedenSwitzerlandSyrian Arab RepublicTajikistanTanzaniaThailandTogoTrinidad and TobagoTunisiaTurkeyTurkmenistanUkraineUnited Arab EmiratesUnited KingdomUnited StatesUpper middle incomeUruguayUzbekistanVenezuela, RBVietnamWorldYemen, Rep.ZambiaZimbabwe Timeline:
This timeline shows a graph from 1972 to 2014 of Tanzania. No data until 1971. Number of actual observations by date: 43.
Source name:
World Development Indicators
Source organization:
IEA Statistics © OECD/IEA 2014 (http://www.iea.org/stats/index.asp), subject to https://www.iea.org/t&c/termsandconditions/
Categories, topics:
Energy & Mining, Infrastructure
Last updated:
apr 23, 2017
Indicators value changes by year
Maximum:
35.562
jan 1, 2010
At the date of observation
Value
Absolute change
Change from previous value
jan 1, 1972
13.646
+13.646
0.0%
jan 1, 1973
13.594
-0.052
-0.38%
jan 1, 1974
13.574
-0.02
-0.15%
jan 1, 1975
13.554
-0.02
-0.15%
jan 1, 1976
13.586
+0.032
0.24%
jan 1, 1977
13.664
+0.078
0.57%
jan 1, 1978
13.537
-0.127
-0.93%
jan 1, 1979
13.525
-0.012
-0.09%
jan 1, 1980
13.542
+0.016
0.12%
jan 1, 1981
13.636
+0.095
0.7%
jan 1, 1982
12.136
-1.5
-11.0%
jan 1, 1983
14.819
+2.683
22.11%
jan 1, 1984
18.492
+3.673
24.79%
jan 1, 1985
21.15
+2.657
14.37%
jan 1, 1986
22.463
+1.313
6.21%
jan 1, 1987
20.681
-1.782
-7.93%
jan 1, 1988
25.629
+4.948
23.93%
jan 1, 1989
23.004
-2.625
-10.24%
jan 1, 1990
23.724
+0.72
3.13%
jan 1, 1991
19.963
-3.761
-15.85%
jan 1, 1992
21.625
+1.661
8.32%
jan 1, 1993
20.65
-0.975
-4.51%
jan 1, 1994
28.848
+8.198
39.7%
jan 1, 1995
19.708
-9.14
-31.68%
jan 1, 1996
12.786
-6.922
-35.12%
jan 1, 1997
9.526
-3.26
-25.49%
jan 1, 1998
11.569
+2.042
21.44%
jan 1, 1999
11.767
+0.199
1.72%
jan 1, 2000
22.367
+10.599
90.07%
jan 1, 2001
22.128
-0.239
-1.07%
jan 1, 2002
24.237
+2.109
9.53%
jan 1, 2003
16.419
-7.818
-32.26%
jan 1, 2004
8.725
-7.694
-46.86%
jan 1, 2005
12.013
+3.288
37.69%
jan 1, 2006
15.302
+3.289
27.38%
jan 1, 2007
26.798
+11.496
75.12%
jan 1, 2008
21.917
-4.881
-18.22%
jan 1, 2009
18.843
-3.074
-14.03%
jan 1, 2010
35.562
+16.72
88.73%
jan 1, 2011
19.833
-15.729
-44.23%
jan 1, 2012
22.757
+2.924
14.74%
jan 1, 2013
18.751
-4.006
-17.6%
jan 1, 2014
20.452
+1.701
9.07%
Ranking of countries by current statistics by years


Comments: