29
/
en
AIzaSyAYiBZKx7MnpbEhh9jyipgxe19OcubqV5w
April 1, 2024
212840
Nigeria
NGA
true
2
1
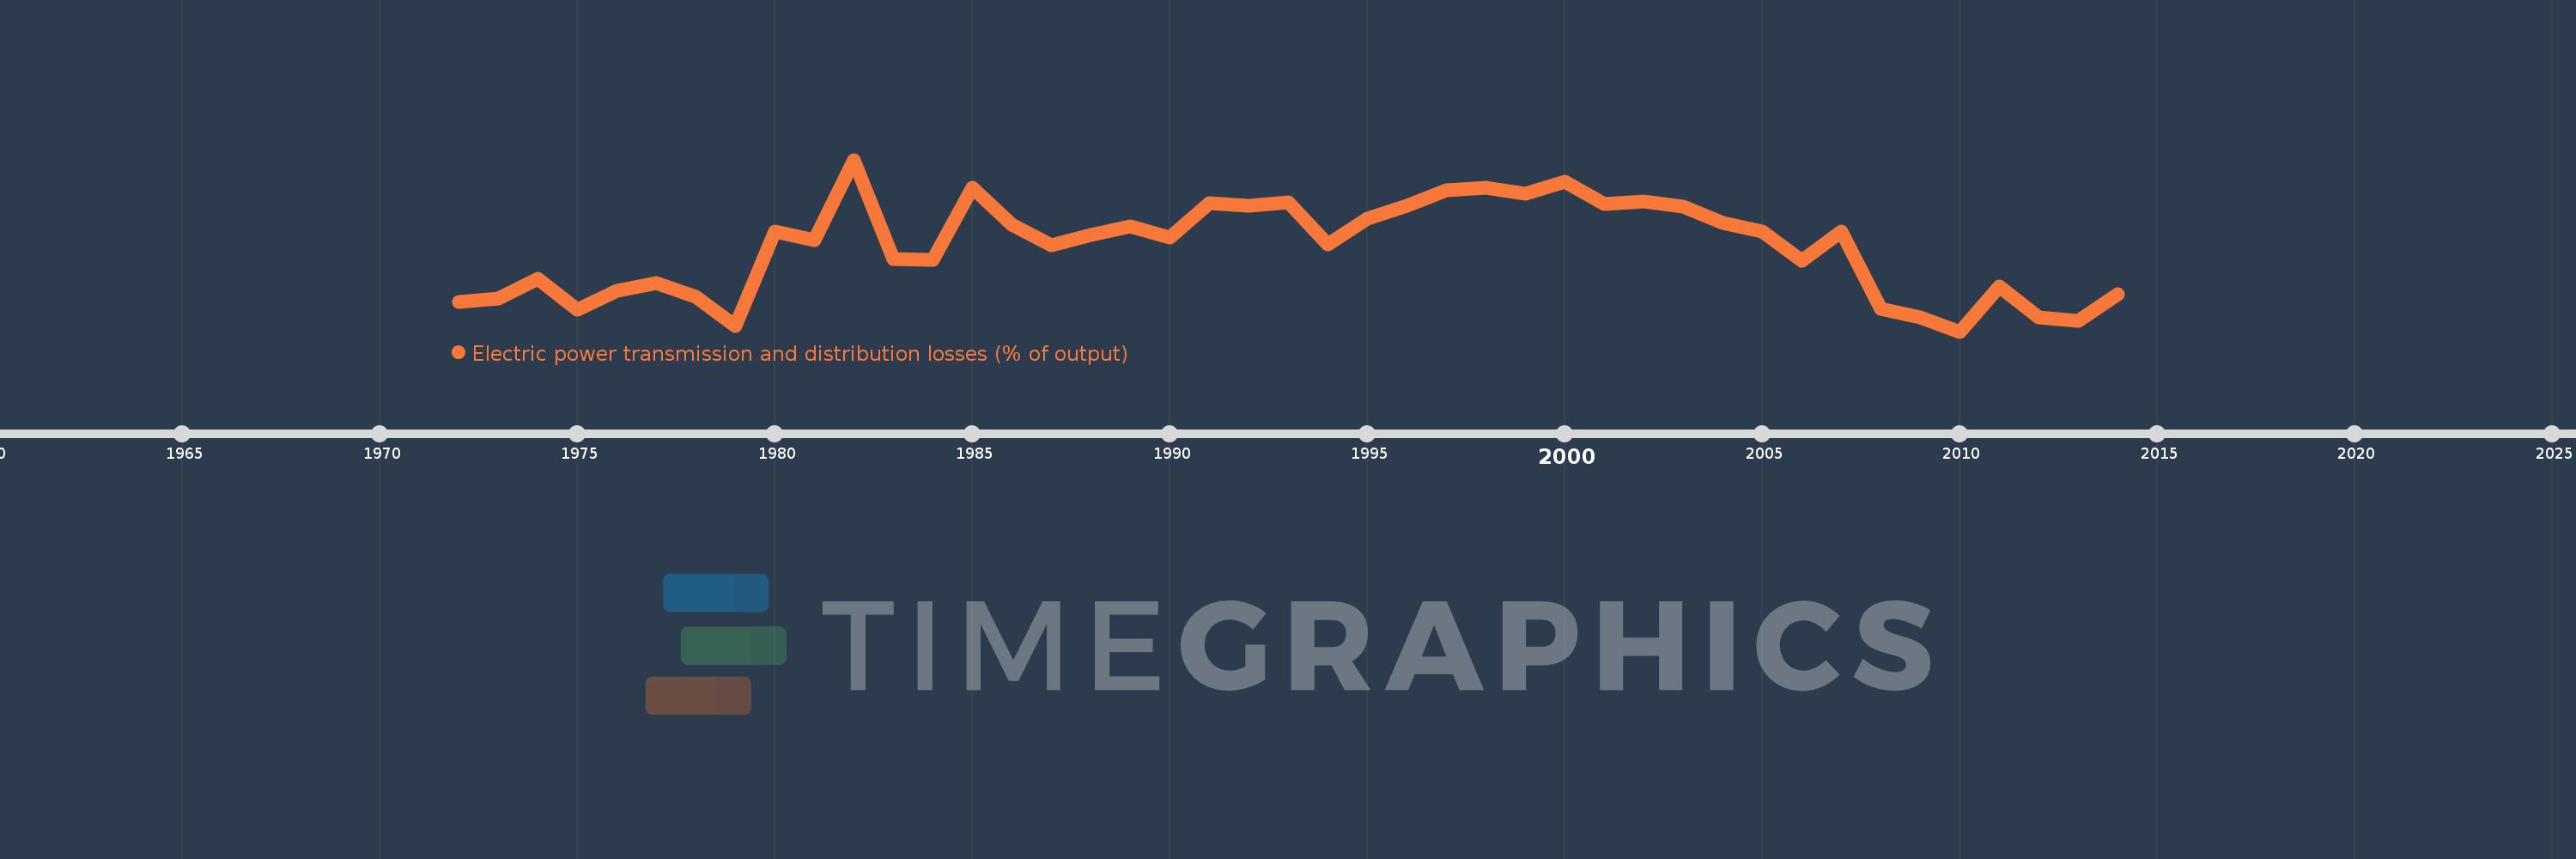
Electric power transmission and distribution losses (% of output)
2014,2013,2012,2011,2010,2009,2008,2007,2006,2005,2004,2003,2002,2001,2000,1999,1998,1997,1996,1995,1994,1993,1992,1991,1990,1989,1988,1987,1986,1985,1984,1983,1982,1981,1980,1979,1978,1977,1976,1975,1974,1973,1972
This statistics in other country:
AlbaniaAlgeriaAngolaArab WorldArgentinaArmeniaAustraliaAustriaAzerbaijanBahrainBangladeshBelarusBelgiumBeninBoliviaBosnia and HerzegovinaBotswanaBrazilBrunei DarussalamBulgariaCambodiaCameroonCanadaCaribbean small statesCentral Europe and the BalticsChileChinaColombiaCongo, Dem. Rep.Congo, Rep.Costa RicaCote d'IvoireCroatiaCubaCuracaoCyprusCzech RepublicDenmarkDominican RepublicEarly-demographic dividendEast Asia & PacificEast Asia & Pacific (excluding high income)East Asia & Pacific (IDA & IBRD countries)EcuadorEgypt, Arab Rep.El SalvadorEritreaEstoniaEthiopiaEuro areaEurope & Central AsiaEurope & Central Asia (excluding high income)Europe & Central Asia (IDA & IBRD countries)European UnionFinlandFragile and conflict affected situationsFranceGabonGeorgiaGermanyGhanaGibraltarGreeceGuatemalaHaitiHeavily indebted poor countries (HIPC)High incomeHondurasHong Kong SAR, ChinaHungaryIBRD onlyIcelandIDA & IBRD totalIDA blendIDA onlyIDA totalIndiaIndonesiaIran, Islamic Rep.IraqIrelandIsraelItalyJamaicaJapanJordanKazakhstanKenyaKorea, Dem. People’s Rep.Korea, Rep.KosovoKuwaitKyrgyz RepublicLate-demographic dividendLatin America & Caribbean Latin America & Caribbean (excluding high income)Latin America & the Caribbean (IDA & IBRD countries)LatviaLeast developed countries: UN classificationLebanonLibyaLithuaniaLow & middle incomeLow incomeLower middle incomeLuxembourgMacedonia, FYRMalaysiaMaltaMauritiusMexicoMiddle East & North AfricaMiddle East & North Africa (excluding high income)Middle East & North Africa (IDA & IBRD countries)Middle incomeMoldovaMongoliaMontenegroMoroccoMozambiqueMyanmarNamibiaNepalNetherlandsNew ZealandNicaraguaNigerNigeriaNorth AmericaNorwayOECD membersOmanOther small statesPakistanPanamaParaguayPeruPhilippinesPolandPortugalPost-demographic dividendPre-demographic dividendQatarRomaniaRussian FederationSaudi ArabiaSenegalSerbiaSingaporeSlovak RepublicSloveniaSmall statesSouth AfricaSouth AsiaSouth Asia (IDA & IBRD)South SudanSpainSri LankaSub-Saharan Africa Sub-Saharan Africa (excluding high income)Sub-Saharan Africa (IDA & IBRD countries)SudanSwedenSwitzerlandSyrian Arab RepublicTajikistanTanzaniaThailandTogoTrinidad and TobagoTunisiaTurkeyTurkmenistanUkraineUnited Arab EmiratesUnited KingdomUnited StatesUpper middle incomeUruguayUzbekistanVenezuela, RBVietnamWorldYemen, Rep.ZambiaZimbabwe Timeline:
This timeline shows a graph from 1972 to 2014 of Nigeria. No data until 1971. Number of actual observations by date: 43.
Source name:
World Development Indicators
Source organization:
IEA Statistics © OECD/IEA 2014 (http://www.iea.org/stats/index.asp), subject to https://www.iea.org/t&c/termsandconditions/
Categories, topics:
Energy & Mining, Infrastructure
Last updated:
apr 23, 2017
Indicators value changes by year
Maximum:
49.267
jan 1, 1982
At the date of observation
Value
Absolute change
Change from previous value
jan 1, 1972
13.249
+13.249
0.0%
jan 1, 1973
14.171
+0.922
6.96%
jan 1, 1974
19.162
+4.991
35.22%
jan 1, 1975
11.412
-7.75
-40.44%
jan 1, 1976
16.253
+4.841
42.42%
jan 1, 1977
18.071
+1.818
11.19%
jan 1, 1978
14.683
-3.388
-18.75%
jan 1, 1979
7.207
-7.476
-50.92%
jan 1, 1980
31.204
+23.997
332.98%
jan 1, 1981
29.07
-2.135
-6.84%
jan 1, 1982
49.267
+20.197
69.48%
jan 1, 1983
24.285
-24.982
-50.71%
jan 1, 1984
24.033
-0.252
-1.04%
jan 1, 1985
42.231
+18.198
75.72%
jan 1, 1986
32.854
-9.377
-22.2%
jan 1, 1987
27.596
-5.258
-16.0%
jan 1, 1988
30.2
+2.604
9.43%
jan 1, 1989
32.409
+2.21
7.32%
jan 1, 1990
29.704
-2.705
-8.35%
jan 1, 1991
38.416
+8.712
29.33%
jan 1, 1992
37.58
-0.836
-2.18%
jan 1, 1993
38.574
+0.993
2.64%
jan 1, 1994
27.852
-10.721
-27.79%
jan 1, 1995
34.325
+6.472
23.24%
jan 1, 1996
37.718
+3.393
9.89%
jan 1, 1997
41.47
+3.752
9.95%
jan 1, 1998
42.272
+0.802
1.93%
jan 1, 1999
40.752
-1.52
-3.6%
jan 1, 2000
43.837
+3.086
7.57%
jan 1, 2001
38.148
-5.69
-12.98%
jan 1, 2002
38.714
+0.567
1.49%
jan 1, 2003
37.531
-1.184
-3.06%
jan 1, 2004
33.393
-4.138
-11.03%
jan 1, 2005
31.081
-2.311
-6.92%
jan 1, 2006
23.705
-7.376
-23.73%
jan 1, 2007
31.073
+7.368
31.08%
jan 1, 2008
11.533
-19.54
-62.89%
jan 1, 2009
9.422
-2.111
-18.3%
jan 1, 2010
5.865
-3.557
-37.75%
jan 1, 2011
17.216
+11.351
193.52%
jan 1, 2012
9.547
-7.669
-44.54%
jan 1, 2013
8.657
-0.891
-9.33%
jan 1, 2014
15.341
+6.685
77.22%
Ranking of countries by current statistics by years


Comments: