29
/
en
AIzaSyAYiBZKx7MnpbEhh9jyipgxe19OcubqV5w
April 1, 2024
206628
Nepal
NPL
true
2
1
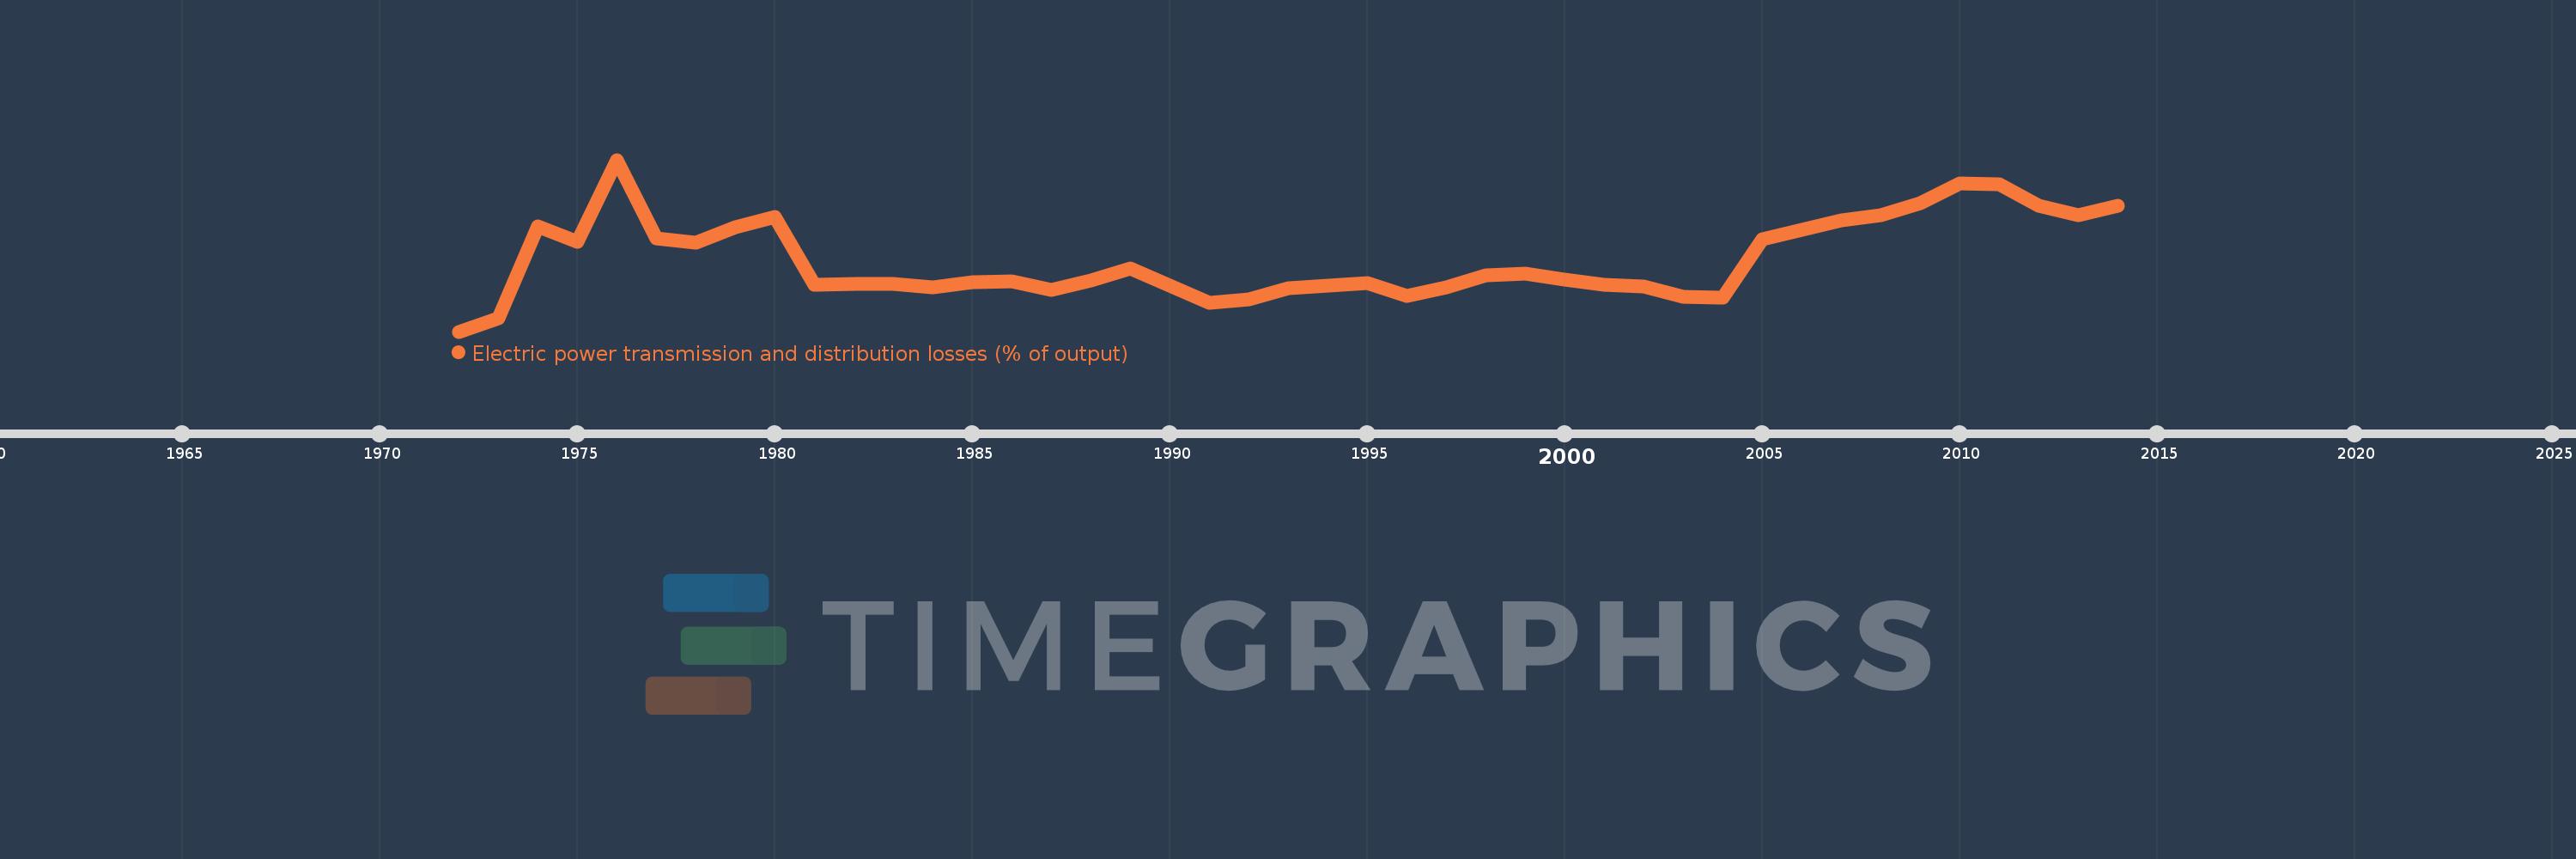
Electric power transmission and distribution losses (% of output)
2014,2013,2012,2011,2010,2009,2008,2007,2006,2005,2004,2003,2002,2001,2000,1999,1998,1997,1996,1995,1994,1993,1992,1991,1990,1989,1988,1987,1986,1985,1984,1983,1982,1981,1980,1979,1978,1977,1976,1975,1974,1973,1972
This statistics in other country:
AlbaniaAlgeriaAngolaArab WorldArgentinaArmeniaAustraliaAustriaAzerbaijanBahrainBangladeshBelarusBelgiumBeninBoliviaBosnia and HerzegovinaBotswanaBrazilBrunei DarussalamBulgariaCambodiaCameroonCanadaCaribbean small statesCentral Europe and the BalticsChileChinaColombiaCongo, Dem. Rep.Congo, Rep.Costa RicaCote d'IvoireCroatiaCubaCuracaoCyprusCzech RepublicDenmarkDominican RepublicEarly-demographic dividendEast Asia & PacificEast Asia & Pacific (excluding high income)East Asia & Pacific (IDA & IBRD countries)EcuadorEgypt, Arab Rep.El SalvadorEritreaEstoniaEthiopiaEuro areaEurope & Central AsiaEurope & Central Asia (excluding high income)Europe & Central Asia (IDA & IBRD countries)European UnionFinlandFragile and conflict affected situationsFranceGabonGeorgiaGermanyGhanaGibraltarGreeceGuatemalaHaitiHeavily indebted poor countries (HIPC)High incomeHondurasHong Kong SAR, ChinaHungaryIBRD onlyIcelandIDA & IBRD totalIDA blendIDA onlyIDA totalIndiaIndonesiaIran, Islamic Rep.IraqIrelandIsraelItalyJamaicaJapanJordanKazakhstanKenyaKorea, Dem. People’s Rep.Korea, Rep.KosovoKuwaitKyrgyz RepublicLate-demographic dividendLatin America & Caribbean Latin America & Caribbean (excluding high income)Latin America & the Caribbean (IDA & IBRD countries)LatviaLeast developed countries: UN classificationLebanonLibyaLithuaniaLow & middle incomeLow incomeLower middle incomeLuxembourgMacedonia, FYRMalaysiaMaltaMauritiusMexicoMiddle East & North AfricaMiddle East & North Africa (excluding high income)Middle East & North Africa (IDA & IBRD countries)Middle incomeMoldovaMongoliaMontenegroMoroccoMozambiqueMyanmarNamibiaNepalNetherlandsNew ZealandNicaraguaNigerNigeriaNorth AmericaNorwayOECD membersOmanOther small statesPakistanPanamaParaguayPeruPhilippinesPolandPortugalPost-demographic dividendPre-demographic dividendQatarRomaniaRussian FederationSaudi ArabiaSenegalSerbiaSingaporeSlovak RepublicSloveniaSmall statesSouth AfricaSouth AsiaSouth Asia (IDA & IBRD)South SudanSpainSri LankaSub-Saharan Africa Sub-Saharan Africa (excluding high income)Sub-Saharan Africa (IDA & IBRD countries)SudanSwedenSwitzerlandSyrian Arab RepublicTajikistanTanzaniaThailandTogoTrinidad and TobagoTunisiaTurkeyTurkmenistanUkraineUnited Arab EmiratesUnited KingdomUnited StatesUpper middle incomeUruguayUzbekistanVenezuela, RBVietnamWorldYemen, Rep.ZambiaZimbabwe Timeline:
This timeline shows a graph from 1972 to 2014 of Nepal. No data until 1971. Number of actual observations by date: 43.
Source name:
World Development Indicators
Source organization:
IEA Statistics © OECD/IEA 2014 (http://www.iea.org/stats/index.asp), subject to https://www.iea.org/t&c/termsandconditions/
Categories, topics:
Energy & Mining, Infrastructure
Last updated:
apr 23, 2017
Indicators value changes by year
Minimum:
15.116
jan 1, 1972
At the date of observation
Value
Absolute change
Change from previous value
jan 1, 1972
15.116
+15.116
0.0%
jan 1, 1973
16.822
+1.706
11.29%
jan 1, 1974
28.846
+12.024
71.47%
jan 1, 1975
26.786
-2.06
-7.14%
jan 1, 1976
37.5
+10.714
40.0%
jan 1, 1977
27.273
-10.227
-27.27%
jan 1, 1978
26.752
-0.521
-1.91%
jan 1, 1979
28.736
+1.984
7.42%
jan 1, 1980
30.052
+1.316
4.58%
jan 1, 1981
21.198
-8.854
-29.46%
jan 1, 1982
21.344
+0.146
0.69%
jan 1, 1983
21.296
-0.048
-0.22%
jan 1, 1984
20.891
-0.405
-1.9%
jan 1, 1985
21.503
+0.611
2.93%
jan 1, 1986
21.628
+0.125
0.58%
jan 1, 1987
20.518
-1.11
-5.13%
jan 1, 1988
21.809
+1.291
6.29%
jan 1, 1989
23.288
+1.479
6.78%
jan 1, 1990
21.089
-2.198
-9.44%
jan 1, 1991
18.907
-2.183
-10.35%
jan 1, 1992
19.313
+0.407
2.15%
jan 1, 1993
20.767
+1.454
7.53%
jan 1, 1994
21.115
+0.347
1.67%
jan 1, 1995
21.485
+0.37
1.75%
jan 1, 1996
19.732
-1.753
-8.16%
jan 1, 1997
20.885
+1.152
5.84%
jan 1, 1998
22.412
+1.528
7.32%
jan 1, 1999
22.72
+0.308
1.37%
jan 1, 2000
21.854
-0.866
-3.81%
jan 1, 2001
21.218
-0.636
-2.91%
jan 1, 2002
20.996
-0.221
-1.04%
jan 1, 2003
19.642
-1.354
-6.45%
jan 1, 2004
19.497
-0.145
-0.74%
jan 1, 2005
27.13
+7.633
39.15%
jan 1, 2006
28.346
+1.216
4.48%
jan 1, 2007
29.658
+1.312
4.63%
jan 1, 2008
30.265
+0.607
2.05%
jan 1, 2009
31.863
+1.598
5.28%
jan 1, 2010
34.446
+2.583
8.11%
jan 1, 2011
34.32
-0.126
-0.37%
jan 1, 2012
31.558
-2.763
-8.05%
jan 1, 2013
30.265
-1.293
-4.1%
jan 1, 2014
31.487
+1.222
4.04%
Ranking of countries by current statistics by years


Comments: