29
/
en
AIzaSyAYiBZKx7MnpbEhh9jyipgxe19OcubqV5w
April 1, 2024
47028
Lower middle income
LMC
false
2
1
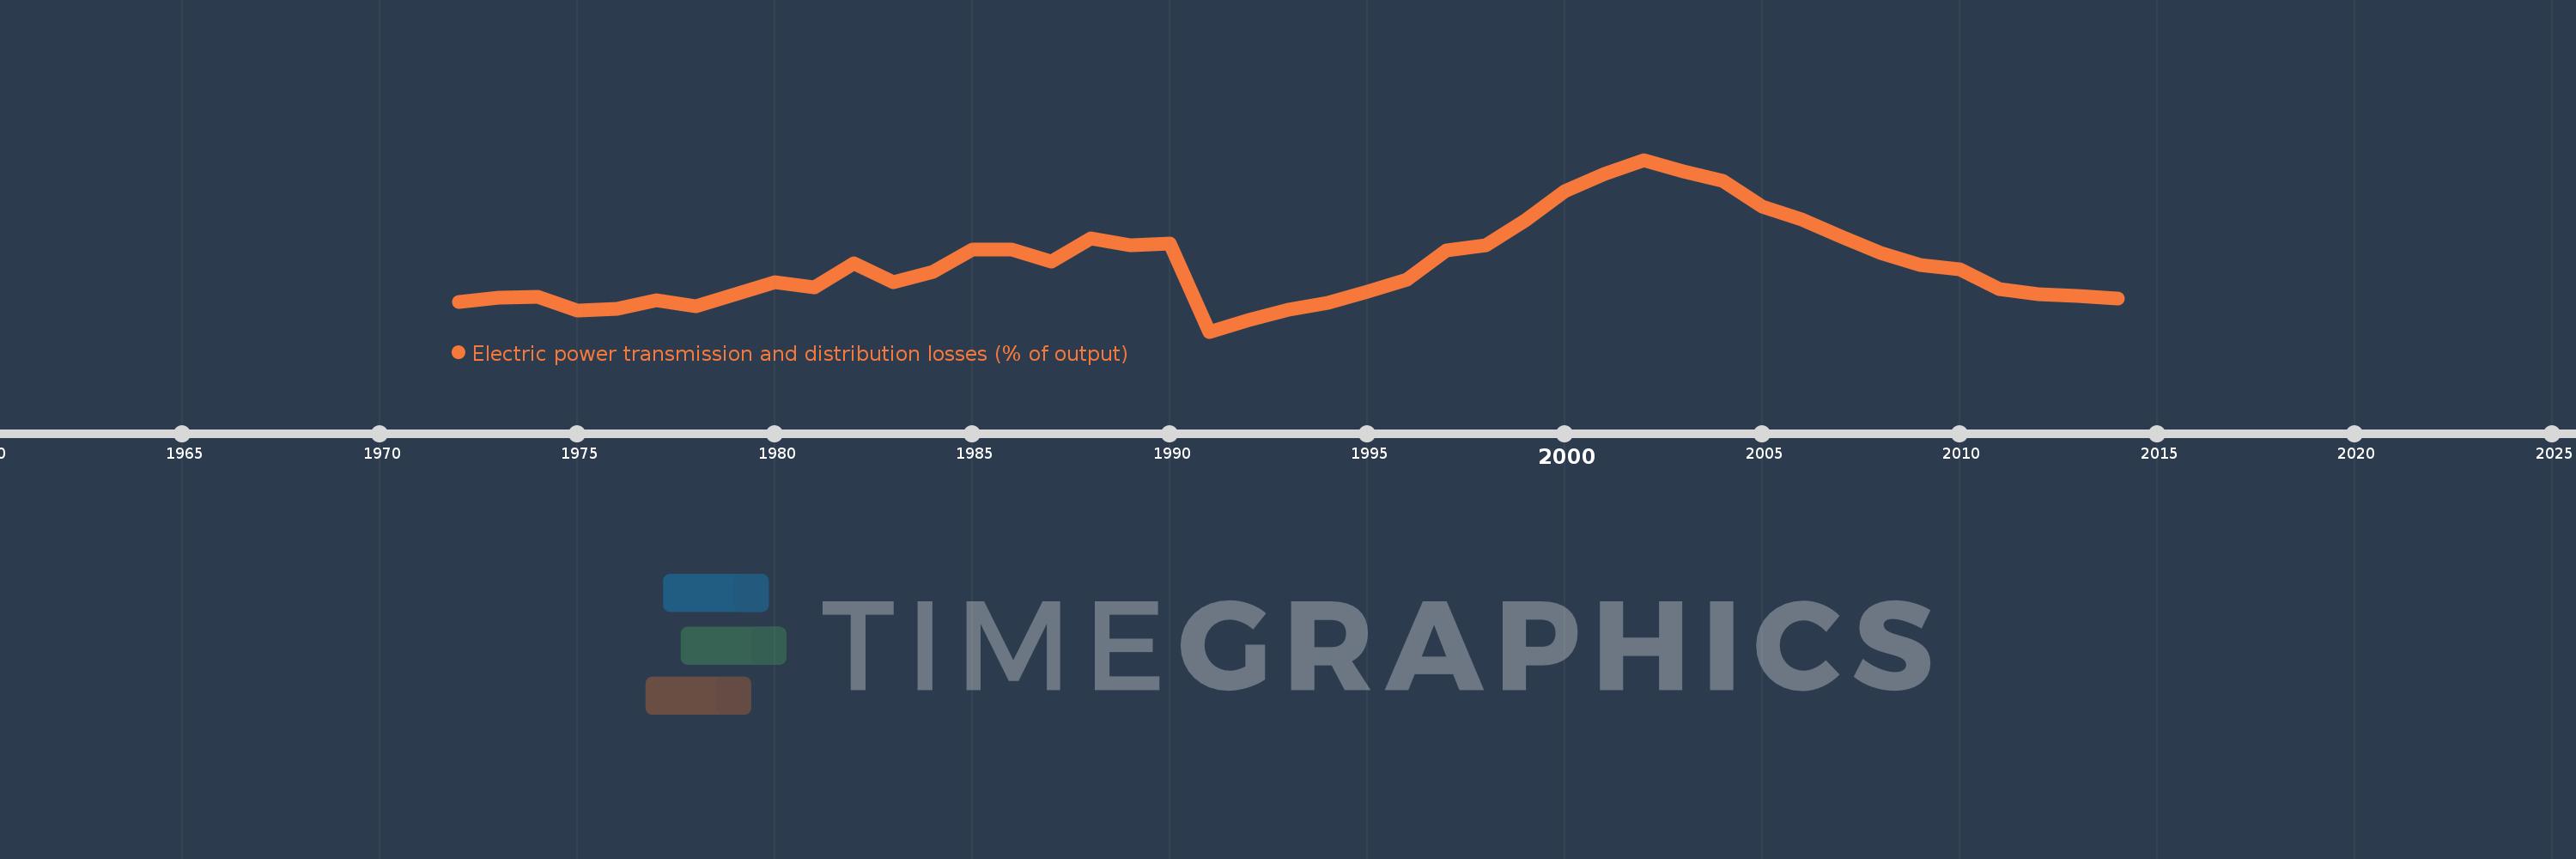
Electric power transmission and distribution losses (% of output)
2014,2013,2012,2011,2010,2009,2008,2007,2006,2005,2004,2003,2002,2001,2000,1999,1998,1997,1996,1995,1994,1993,1992,1991,1990,1989,1988,1987,1986,1985,1984,1983,1982,1981,1980,1979,1978,1977,1976,1975,1974,1973,1972
This statistics in other country:
AlbaniaAlgeriaAngolaArab WorldArgentinaArmeniaAustraliaAustriaAzerbaijanBahrainBangladeshBelarusBelgiumBeninBoliviaBosnia and HerzegovinaBotswanaBrazilBrunei DarussalamBulgariaCambodiaCameroonCanadaCaribbean small statesCentral Europe and the BalticsChileChinaColombiaCongo, Dem. Rep.Congo, Rep.Costa RicaCote d'IvoireCroatiaCubaCuracaoCyprusCzech RepublicDenmarkDominican RepublicEarly-demographic dividendEast Asia & PacificEast Asia & Pacific (excluding high income)East Asia & Pacific (IDA & IBRD countries)EcuadorEgypt, Arab Rep.El SalvadorEritreaEstoniaEthiopiaEuro areaEurope & Central AsiaEurope & Central Asia (excluding high income)Europe & Central Asia (IDA & IBRD countries)European UnionFinlandFragile and conflict affected situationsFranceGabonGeorgiaGermanyGhanaGibraltarGreeceGuatemalaHaitiHeavily indebted poor countries (HIPC)High incomeHondurasHong Kong SAR, ChinaHungaryIBRD onlyIcelandIDA & IBRD totalIDA blendIDA onlyIDA totalIndiaIndonesiaIran, Islamic Rep.IraqIrelandIsraelItalyJamaicaJapanJordanKazakhstanKenyaKorea, Dem. People’s Rep.Korea, Rep.KosovoKuwaitKyrgyz RepublicLate-demographic dividendLatin America & Caribbean Latin America & Caribbean (excluding high income)Latin America & the Caribbean (IDA & IBRD countries)LatviaLeast developed countries: UN classificationLebanonLibyaLithuaniaLow & middle incomeLow incomeLower middle incomeLuxembourgMacedonia, FYRMalaysiaMaltaMauritiusMexicoMiddle East & North AfricaMiddle East & North Africa (excluding high income)Middle East & North Africa (IDA & IBRD countries)Middle incomeMoldovaMongoliaMontenegroMoroccoMozambiqueMyanmarNamibiaNepalNetherlandsNew ZealandNicaraguaNigerNigeriaNorth AmericaNorwayOECD membersOmanOther small statesPakistanPanamaParaguayPeruPhilippinesPolandPortugalPost-demographic dividendPre-demographic dividendQatarRomaniaRussian FederationSaudi ArabiaSenegalSerbiaSingaporeSlovak RepublicSloveniaSmall statesSouth AfricaSouth AsiaSouth Asia (IDA & IBRD)South SudanSpainSri LankaSub-Saharan Africa Sub-Saharan Africa (excluding high income)Sub-Saharan Africa (IDA & IBRD countries)SudanSwedenSwitzerlandSyrian Arab RepublicTajikistanTanzaniaThailandTogoTrinidad and TobagoTunisiaTurkeyTurkmenistanUkraineUnited Arab EmiratesUnited KingdomUnited StatesUpper middle incomeUruguayUzbekistanVenezuela, RBVietnamWorldYemen, Rep.ZambiaZimbabwe Timeline:
This timeline shows a graph from 1972 to 2014 of Lower middle income. No data until 1971. Number of actual observations by date: 43.
Source name:
World Development Indicators
Source organization:
IEA Statistics © OECD/IEA 2014 (http://www.iea.org/stats/index.asp), subject to https://www.iea.org/t&c/termsandconditions/
Categories, topics:
Energy & Mining, Infrastructure
Last updated:
apr 23, 2017
Indicators value changes by year
Minimum:
13.509
jan 1, 1991
Maximum:
22.354
jan 1, 2002
At the date of observation
Value
Absolute change
Change from previous value
jan 1, 1972
15.024
+15.024
0.0%
jan 1, 1973
15.268
+0.244
1.62%
jan 1, 1974
15.289
+0.021
0.14%
jan 1, 1975
14.586
-0.703
-4.6%
jan 1, 1976
14.699
+0.113
0.78%
jan 1, 1977
15.145
+0.446
3.04%
jan 1, 1978
14.805
-0.341
-2.25%
jan 1, 1979
15.445
+0.64
4.32%
jan 1, 1980
16.036
+0.591
3.83%
jan 1, 1981
15.78
-0.256
-1.6%
jan 1, 1982
17.014
+1.233
7.81%
jan 1, 1983
16.049
-0.965
-5.67%
jan 1, 1984
16.6
+0.552
3.44%
jan 1, 1985
17.749
+1.149
6.92%
jan 1, 1986
17.746
-0.004
-0.02%
jan 1, 1987
17.123
-0.622
-3.51%
jan 1, 1988
18.324
+1.201
7.01%
jan 1, 1989
17.942
-0.382
-2.09%
jan 1, 1990
18.038
+0.096
0.53%
jan 1, 1991
13.509
-4.529
-25.11%
jan 1, 1992
14.092
+0.583
4.32%
jan 1, 1993
14.625
+0.533
3.78%
jan 1, 1994
15.012
+0.387
2.65%
jan 1, 1995
15.554
+0.541
3.61%
jan 1, 1996
16.19
+0.636
4.09%
jan 1, 1997
17.691
+1.501
9.27%
jan 1, 1998
17.948
+0.258
1.46%
jan 1, 1999
19.218
+1.27
7.08%
jan 1, 2000
20.75
+1.532
7.97%
jan 1, 2001
21.611
+0.861
4.15%
jan 1, 2002
22.354
+0.743
3.44%
jan 1, 2003
21.753
-0.601
-2.69%
jan 1, 2004
21.252
-0.5
-2.3%
jan 1, 2005
19.957
-1.295
-6.09%
jan 1, 2006
19.297
-0.66
-3.31%
jan 1, 2007
18.381
-0.915
-4.74%
jan 1, 2008
17.544
-0.837
-4.56%
jan 1, 2009
16.955
-0.589
-3.36%
jan 1, 2010
16.728
-0.228
-1.34%
jan 1, 2011
15.713
-1.015
-6.07%
jan 1, 2012
15.436
-0.277
-1.76%
jan 1, 2013
15.332
-0.104
-0.67%
jan 1, 2014
15.224
-0.108
-0.7%
Ranking of countries by current statistics by years


Comments: