29
/
en
AIzaSyAYiBZKx7MnpbEhh9jyipgxe19OcubqV5w
April 1, 2024
225787
Portugal
PRT
true
2
1
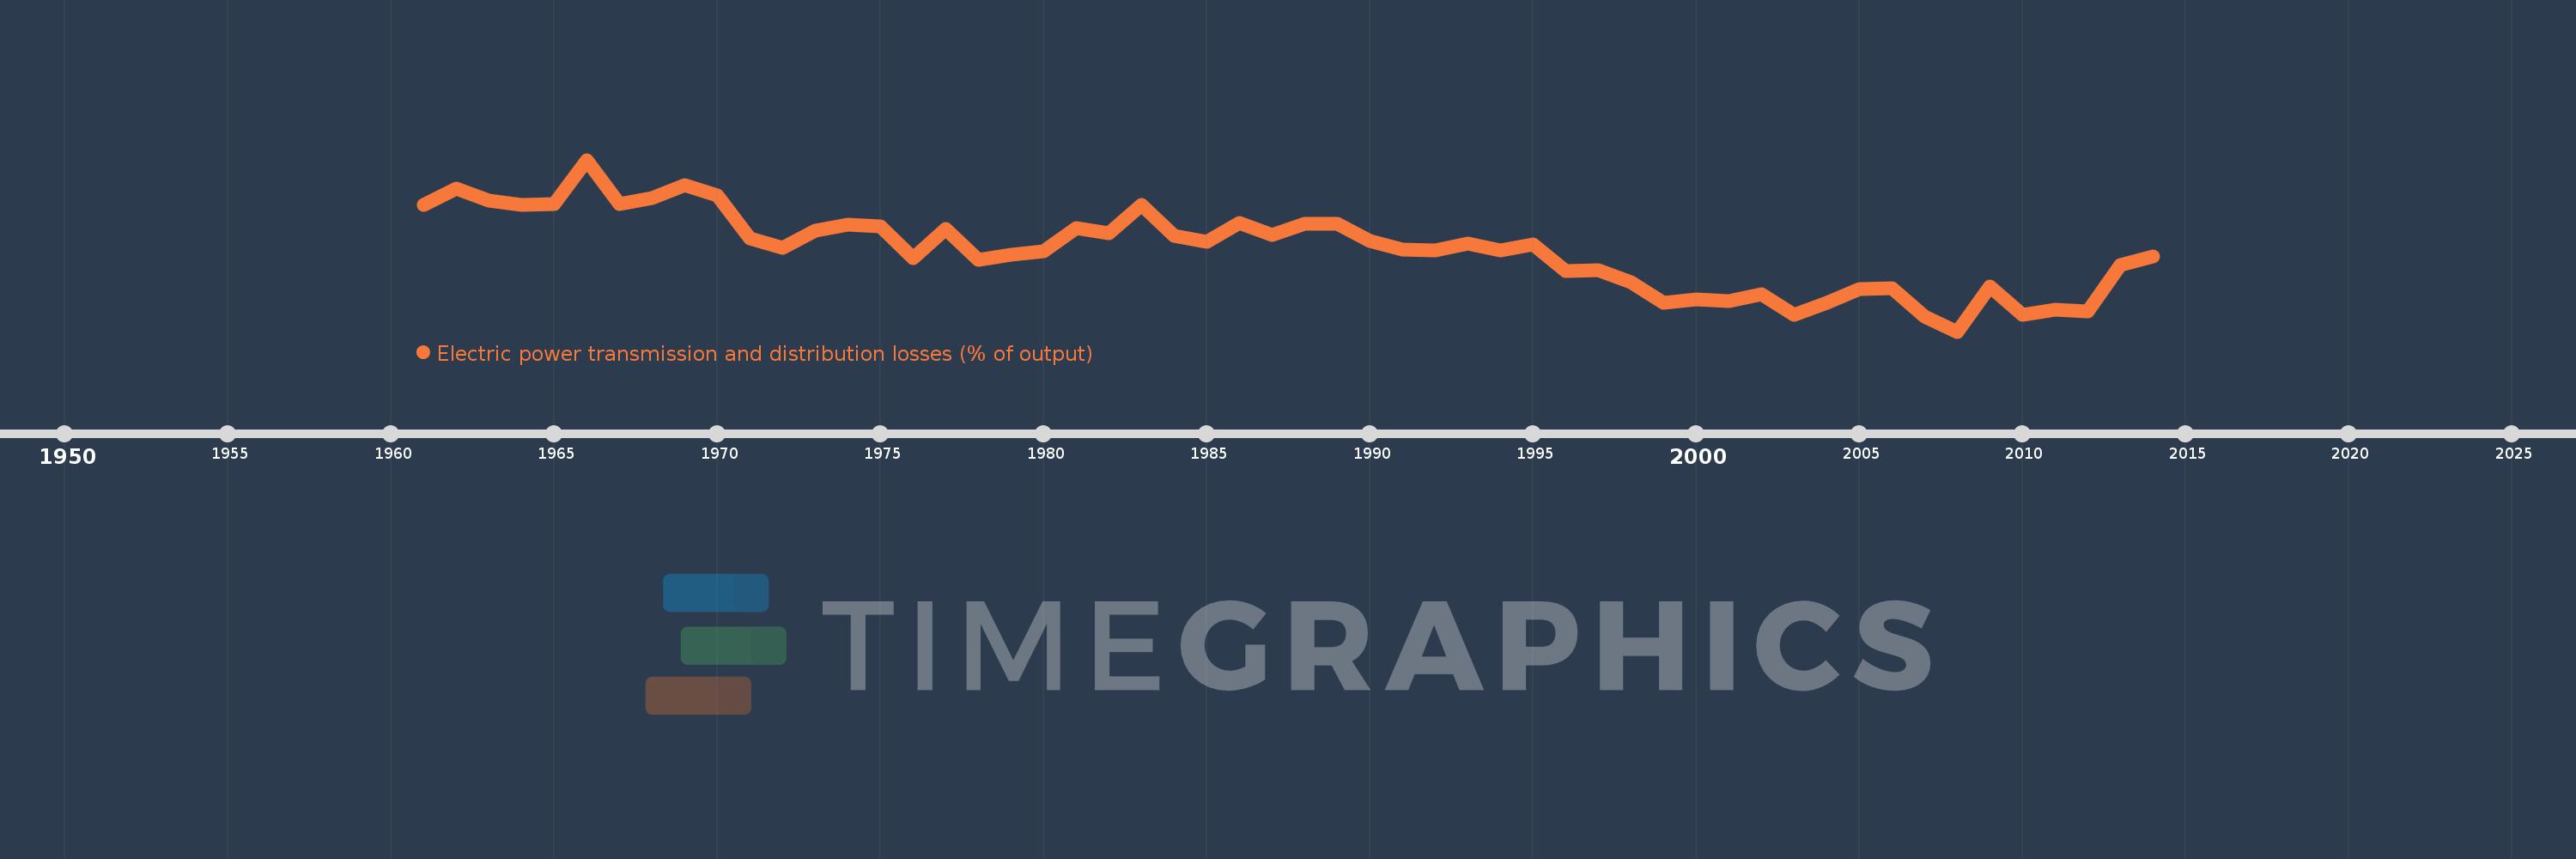
Electric power transmission and distribution losses (% of output)
2014,2013,2012,2011,2010,2009,2008,2007,2006,2005,2004,2003,2002,2001,2000,1999,1998,1997,1996,1995,1994,1993,1992,1991,1990,1989,1988,1987,1986,1985,1984,1983,1982,1981,1980,1979,1978,1977,1976,1975,1974,1973,1972,1971,1970,1969,1968,1967,1966,1965,1964,1963,1962,1961
This statistics in other country:
AlbaniaAlgeriaAngolaArab WorldArgentinaArmeniaAustraliaAustriaAzerbaijanBahrainBangladeshBelarusBelgiumBeninBoliviaBosnia and HerzegovinaBotswanaBrazilBrunei DarussalamBulgariaCambodiaCameroonCanadaCaribbean small statesCentral Europe and the BalticsChileChinaColombiaCongo, Dem. Rep.Congo, Rep.Costa RicaCote d'IvoireCroatiaCubaCuracaoCyprusCzech RepublicDenmarkDominican RepublicEarly-demographic dividendEast Asia & PacificEast Asia & Pacific (excluding high income)East Asia & Pacific (IDA & IBRD countries)EcuadorEgypt, Arab Rep.El SalvadorEritreaEstoniaEthiopiaEuro areaEurope & Central AsiaEurope & Central Asia (excluding high income)Europe & Central Asia (IDA & IBRD countries)European UnionFinlandFragile and conflict affected situationsFranceGabonGeorgiaGermanyGhanaGibraltarGreeceGuatemalaHaitiHeavily indebted poor countries (HIPC)High incomeHondurasHong Kong SAR, ChinaHungaryIBRD onlyIcelandIDA & IBRD totalIDA blendIDA onlyIDA totalIndiaIndonesiaIran, Islamic Rep.IraqIrelandIsraelItalyJamaicaJapanJordanKazakhstanKenyaKorea, Dem. People’s Rep.Korea, Rep.KosovoKuwaitKyrgyz RepublicLate-demographic dividendLatin America & Caribbean Latin America & Caribbean (excluding high income)Latin America & the Caribbean (IDA & IBRD countries)LatviaLeast developed countries: UN classificationLebanonLibyaLithuaniaLow & middle incomeLow incomeLower middle incomeLuxembourgMacedonia, FYRMalaysiaMaltaMauritiusMexicoMiddle East & North AfricaMiddle East & North Africa (excluding high income)Middle East & North Africa (IDA & IBRD countries)Middle incomeMoldovaMongoliaMontenegroMoroccoMozambiqueMyanmarNamibiaNepalNetherlandsNew ZealandNicaraguaNigerNigeriaNorth AmericaNorwayOECD membersOmanOther small statesPakistanPanamaParaguayPeruPhilippinesPolandPortugalPost-demographic dividendPre-demographic dividendQatarRomaniaRussian FederationSaudi ArabiaSenegalSerbiaSingaporeSlovak RepublicSloveniaSmall statesSouth AfricaSouth AsiaSouth Asia (IDA & IBRD)South SudanSpainSri LankaSub-Saharan Africa Sub-Saharan Africa (excluding high income)Sub-Saharan Africa (IDA & IBRD countries)SudanSwedenSwitzerlandSyrian Arab RepublicTajikistanTanzaniaThailandTogoTrinidad and TobagoTunisiaTurkeyTurkmenistanUkraineUnited Arab EmiratesUnited KingdomUnited StatesUpper middle incomeUruguayUzbekistanVenezuela, RBVietnamWorldYemen, Rep.ZambiaZimbabwe Timeline:
This timeline shows a graph from 1961 to 2014 of Portugal. No data until 1960. Number of actual observations by date: 54.
Source name:
World Development Indicators
Source organization:
IEA Statistics © OECD/IEA 2014 (http://www.iea.org/stats/index.asp), subject to https://www.iea.org/t&c/termsandconditions/
Categories, topics:
Energy & Mining, Infrastructure
Last updated:
apr 23, 2017
Indicators value changes by year
Maximum:
15.973
jan 1, 1966
At the date of observation
Value
Absolute change
Change from previous value
jan 1, 1961
13.541
+13.541
0.0%
jan 1, 1962
14.443
+0.902
6.66%
jan 1, 1963
13.791
-0.651
-4.51%
jan 1, 1964
13.576
-0.216
-1.56%
jan 1, 1965
13.628
+0.052
0.38%
jan 1, 1966
15.973
+2.346
17.21%
jan 1, 1967
13.618
-2.356
-14.75%
jan 1, 1968
13.909
+0.291
2.14%
jan 1, 1969
14.633
+0.725
5.21%
jan 1, 1970
14.046
-0.587
-4.01%
jan 1, 1971
11.764
-2.282
-16.25%
jan 1, 1972
11.284
-0.48
-4.08%
jan 1, 1973
12.183
+0.899
7.97%
jan 1, 1974
12.49
+0.307
2.52%
jan 1, 1975
12.41
-0.08
-0.64%
jan 1, 1976
10.7
-1.71
-13.78%
jan 1, 1977
12.283
+1.584
14.8%
jan 1, 1978
10.613
-1.67
-13.6%
jan 1, 1979
10.905
+0.291
2.75%
jan 1, 1980
11.058
+0.153
1.4%
jan 1, 1981
12.298
+1.24
11.21%
jan 1, 1982
12.044
-0.254
-2.06%
jan 1, 1983
13.577
+1.533
12.72%
jan 1, 1984
11.909
-1.667
-12.28%
jan 1, 1985
11.576
-0.333
-2.8%
jan 1, 1986
12.6
+1.024
8.84%
jan 1, 1987
11.955
-0.645
-5.12%
jan 1, 1988
12.535
+0.581
4.86%
jan 1, 1989
12.569
+0.034
0.27%
jan 1, 1990
11.621
-0.948
-7.54%
jan 1, 1991
11.151
-0.469
-4.04%
jan 1, 1992
11.11
-0.041
-0.37%
jan 1, 1993
11.477
+0.367
3.3%
jan 1, 1994
11.12
-0.357
-3.11%
jan 1, 1995
11.443
+0.323
2.9%
jan 1, 1996
10.044
-1.399
-12.23%
jan 1, 1997
10.077
+0.033
0.33%
jan 1, 1998
9.424
-0.653
-6.48%
jan 1, 1999
8.326
-1.097
-11.64%
jan 1, 2000
8.495
+0.169
2.03%
jan 1, 2001
8.413
-0.082
-0.96%
jan 1, 2002
8.787
+0.374
4.45%
jan 1, 2003
7.671
-1.116
-12.7%
jan 1, 2004
8.342
+0.671
8.75%
jan 1, 2005
9.05
+0.708
8.49%
jan 1, 2006
9.119
+0.069
0.76%
jan 1, 2007
7.588
-1.531
-16.79%
jan 1, 2008
6.781
-0.807
-10.64%
jan 1, 2009
9.201
+2.421
35.7%
jan 1, 2010
7.663
-1.538
-16.72%
jan 1, 2011
7.972
+0.308
4.02%
jan 1, 2012
7.882
-0.089
-1.12%
jan 1, 2013
10.328
+2.445
31.02%
jan 1, 2014
10.795
+0.467
4.52%
Ranking of countries by current statistics by years


Comments: