29
/
en
AIzaSyAYiBZKx7MnpbEhh9jyipgxe19OcubqV5w
April 1, 2024
36485
IBRD only
IBD
false
2
1
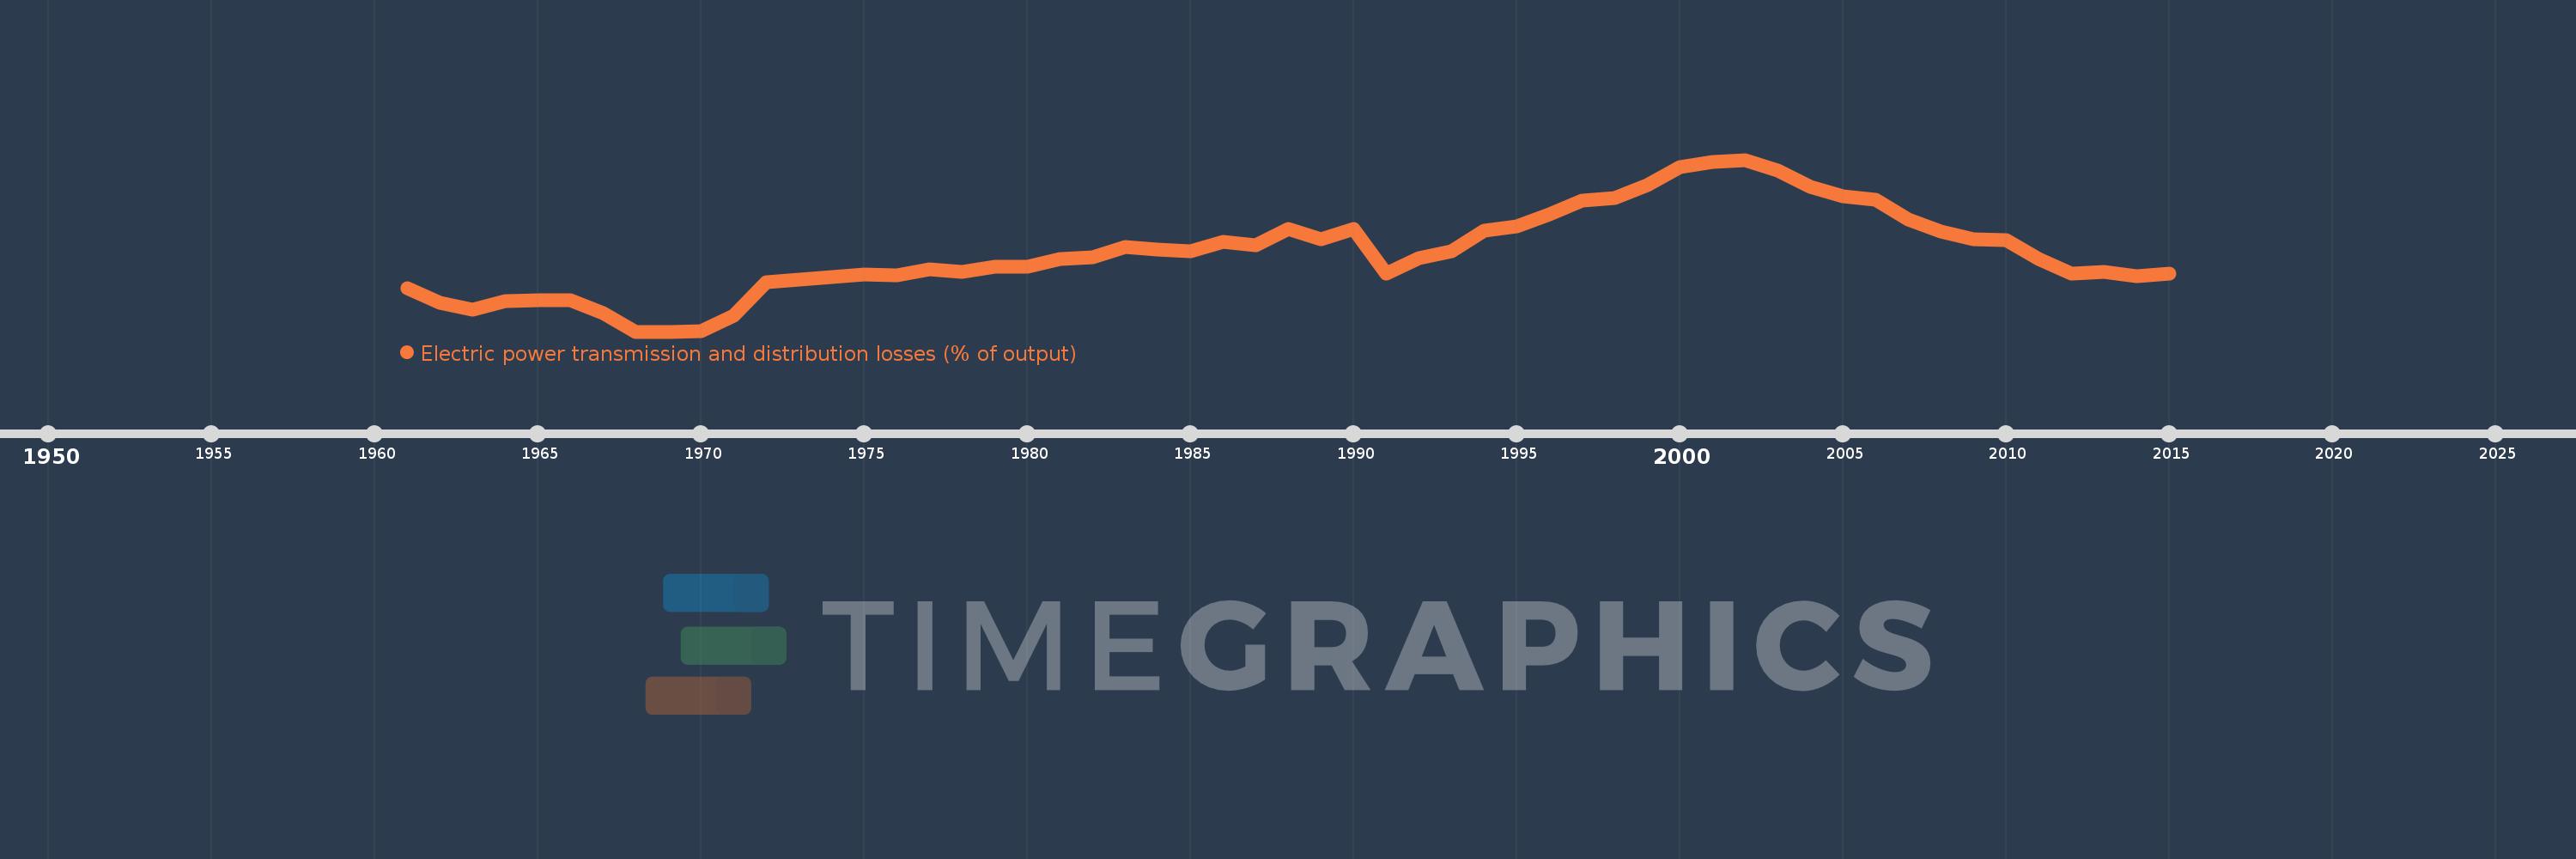
Electric power transmission and distribution losses (% of output)
2015,2014,2013,2012,2011,2010,2009,2008,2007,2006,2005,2004,2003,2002,2001,2000,1999,1998,1997,1996,1995,1994,1993,1992,1991,1990,1989,1988,1987,1986,1985,1984,1983,1982,1981,1980,1979,1978,1977,1976,1975,1974,1973,1972,1971,1970,1969,1968,1967,1966,1965,1964,1963,1962,1961
This statistics in other country:
AlbaniaAlgeriaAngolaArab WorldArgentinaArmeniaAustraliaAustriaAzerbaijanBahrainBangladeshBelarusBelgiumBeninBoliviaBosnia and HerzegovinaBotswanaBrazilBrunei DarussalamBulgariaCambodiaCameroonCanadaCaribbean small statesCentral Europe and the BalticsChileChinaColombiaCongo, Dem. Rep.Congo, Rep.Costa RicaCote d'IvoireCroatiaCubaCuracaoCyprusCzech RepublicDenmarkDominican RepublicEarly-demographic dividendEast Asia & PacificEast Asia & Pacific (excluding high income)East Asia & Pacific (IDA & IBRD countries)EcuadorEgypt, Arab Rep.El SalvadorEritreaEstoniaEthiopiaEuro areaEurope & Central AsiaEurope & Central Asia (excluding high income)Europe & Central Asia (IDA & IBRD countries)European UnionFinlandFragile and conflict affected situationsFranceGabonGeorgiaGermanyGhanaGibraltarGreeceGuatemalaHaitiHeavily indebted poor countries (HIPC)High incomeHondurasHong Kong SAR, ChinaHungaryIBRD onlyIcelandIDA & IBRD totalIDA blendIDA onlyIDA totalIndiaIndonesiaIran, Islamic Rep.IraqIrelandIsraelItalyJamaicaJapanJordanKazakhstanKenyaKorea, Dem. People’s Rep.Korea, Rep.KosovoKuwaitKyrgyz RepublicLate-demographic dividendLatin America & Caribbean Latin America & Caribbean (excluding high income)Latin America & the Caribbean (IDA & IBRD countries)LatviaLeast developed countries: UN classificationLebanonLibyaLithuaniaLow & middle incomeLow incomeLower middle incomeLuxembourgMacedonia, FYRMalaysiaMaltaMauritiusMexicoMiddle East & North AfricaMiddle East & North Africa (excluding high income)Middle East & North Africa (IDA & IBRD countries)Middle incomeMoldovaMongoliaMontenegroMoroccoMozambiqueMyanmarNamibiaNepalNetherlandsNew ZealandNicaraguaNigerNigeriaNorth AmericaNorwayOECD membersOmanOther small statesPakistanPanamaParaguayPeruPhilippinesPolandPortugalPost-demographic dividendPre-demographic dividendQatarRomaniaRussian FederationSaudi ArabiaSenegalSerbiaSingaporeSlovak RepublicSloveniaSmall statesSouth AfricaSouth AsiaSouth Asia (IDA & IBRD)South SudanSpainSri LankaSub-Saharan Africa Sub-Saharan Africa (excluding high income)Sub-Saharan Africa (IDA & IBRD countries)SudanSwedenSwitzerlandSyrian Arab RepublicTajikistanTanzaniaThailandTogoTrinidad and TobagoTunisiaTurkeyTurkmenistanUkraineUnited Arab EmiratesUnited KingdomUnited StatesUpper middle incomeUruguayUzbekistanVenezuela, RBVietnamWorldYemen, Rep.ZambiaZimbabwe Timeline:
This timeline shows a graph from 1961 to 2015 of IBRD only. No data until 1960. Number of actual observations by date: 55.
Source name:
World Development Indicators
Source organization:
IEA Statistics © OECD/IEA 2014 (http://www.iea.org/stats/index.asp), subject to https://www.iea.org/t&c/termsandconditions/
Categories, topics:
Energy & Mining, Infrastructure
Last updated:
apr 23, 2017
Indicators value changes by year
Maximum:
13.346
jan 1, 2002
At the date of observation
Value
Absolute change
Change from previous value
jan 1, 1961
9.593
+9.593
0.0%
jan 1, 1962
9.188
-0.404
-4.22%
jan 1, 1963
8.976
-0.212
-2.31%
jan 1, 1964
9.224
+0.248
2.76%
jan 1, 1965
9.256
+0.032
0.34%
jan 1, 1966
9.251
-0.005
-0.05%
jan 1, 1967
8.889
-0.362
-3.91%
jan 1, 1968
8.339
-0.551
-6.2%
jan 1, 1969
8.339
+0.0
0.0%
jan 1, 1970
8.34
+0.001
0.01%
jan 1, 1971
8.809
+0.469
5.62%
jan 1, 1972
9.769
+0.96
10.9%
jan 1, 1973
9.844
+0.075
0.76%
jan 1, 1974
9.927
+0.083
0.85%
jan 1, 1975
9.992
+0.064
0.65%
jan 1, 1976
9.989
-0.002
-0.02%
jan 1, 1977
10.152
+0.162
1.62%
jan 1, 1978
10.067
-0.085
-0.83%
jan 1, 1979
10.234
+0.167
1.66%
jan 1, 1980
10.224
-0.01
-0.1%
jan 1, 1981
10.452
+0.228
2.23%
jan 1, 1982
10.499
+0.046
0.44%
jan 1, 1983
10.801
+0.303
2.88%
jan 1, 1984
10.73
-0.072
-0.66%
jan 1, 1985
10.692
-0.038
-0.35%
jan 1, 1986
10.948
+0.256
2.4%
jan 1, 1987
10.862
-0.086
-0.79%
jan 1, 1988
11.343
+0.481
4.42%
jan 1, 1989
11.035
-0.307
-2.71%
jan 1, 1990
11.337
+0.302
2.73%
jan 1, 1991
10.017
-1.32
-11.65%
jan 1, 1992
10.481
+0.464
4.64%
jan 1, 1993
10.678
+0.197
1.88%
jan 1, 1994
11.278
+0.6
5.62%
jan 1, 1995
11.409
+0.131
1.16%
jan 1, 1996
11.767
+0.358
3.14%
jan 1, 1997
12.155
+0.389
3.3%
jan 1, 1998
12.236
+0.081
0.66%
jan 1, 1999
12.615
+0.379
3.09%
jan 1, 2000
13.13
+0.515
4.08%
jan 1, 2001
13.295
+0.165
1.26%
jan 1, 2002
13.346
+0.05
0.38%
jan 1, 2003
13.041
-0.305
-2.29%
jan 1, 2004
12.566
-0.475
-3.64%
jan 1, 2005
12.283
-0.283
-2.25%
jan 1, 2006
12.179
-0.104
-0.84%
jan 1, 2007
11.618
-0.561
-4.61%
jan 1, 2008
11.248
-0.37
-3.19%
jan 1, 2009
11.036
-0.212
-1.88%
jan 1, 2010
11.013
-0.023
-0.21%
jan 1, 2011
10.447
-0.566
-5.14%
jan 1, 2012
10.029
-0.417
-4.0%
jan 1, 2013
10.073
+0.044
0.44%
jan 1, 2014
9.961
-0.112
-1.11%
jan 1, 2015
10.036
+0.075
0.75%
Ranking of countries by current statistics by years


Comments: