29
/
en
AIzaSyAYiBZKx7MnpbEhh9jyipgxe19OcubqV5w
April 1, 2024
57995
South Asia (IDA & IBRD)
TSA
false
2
1
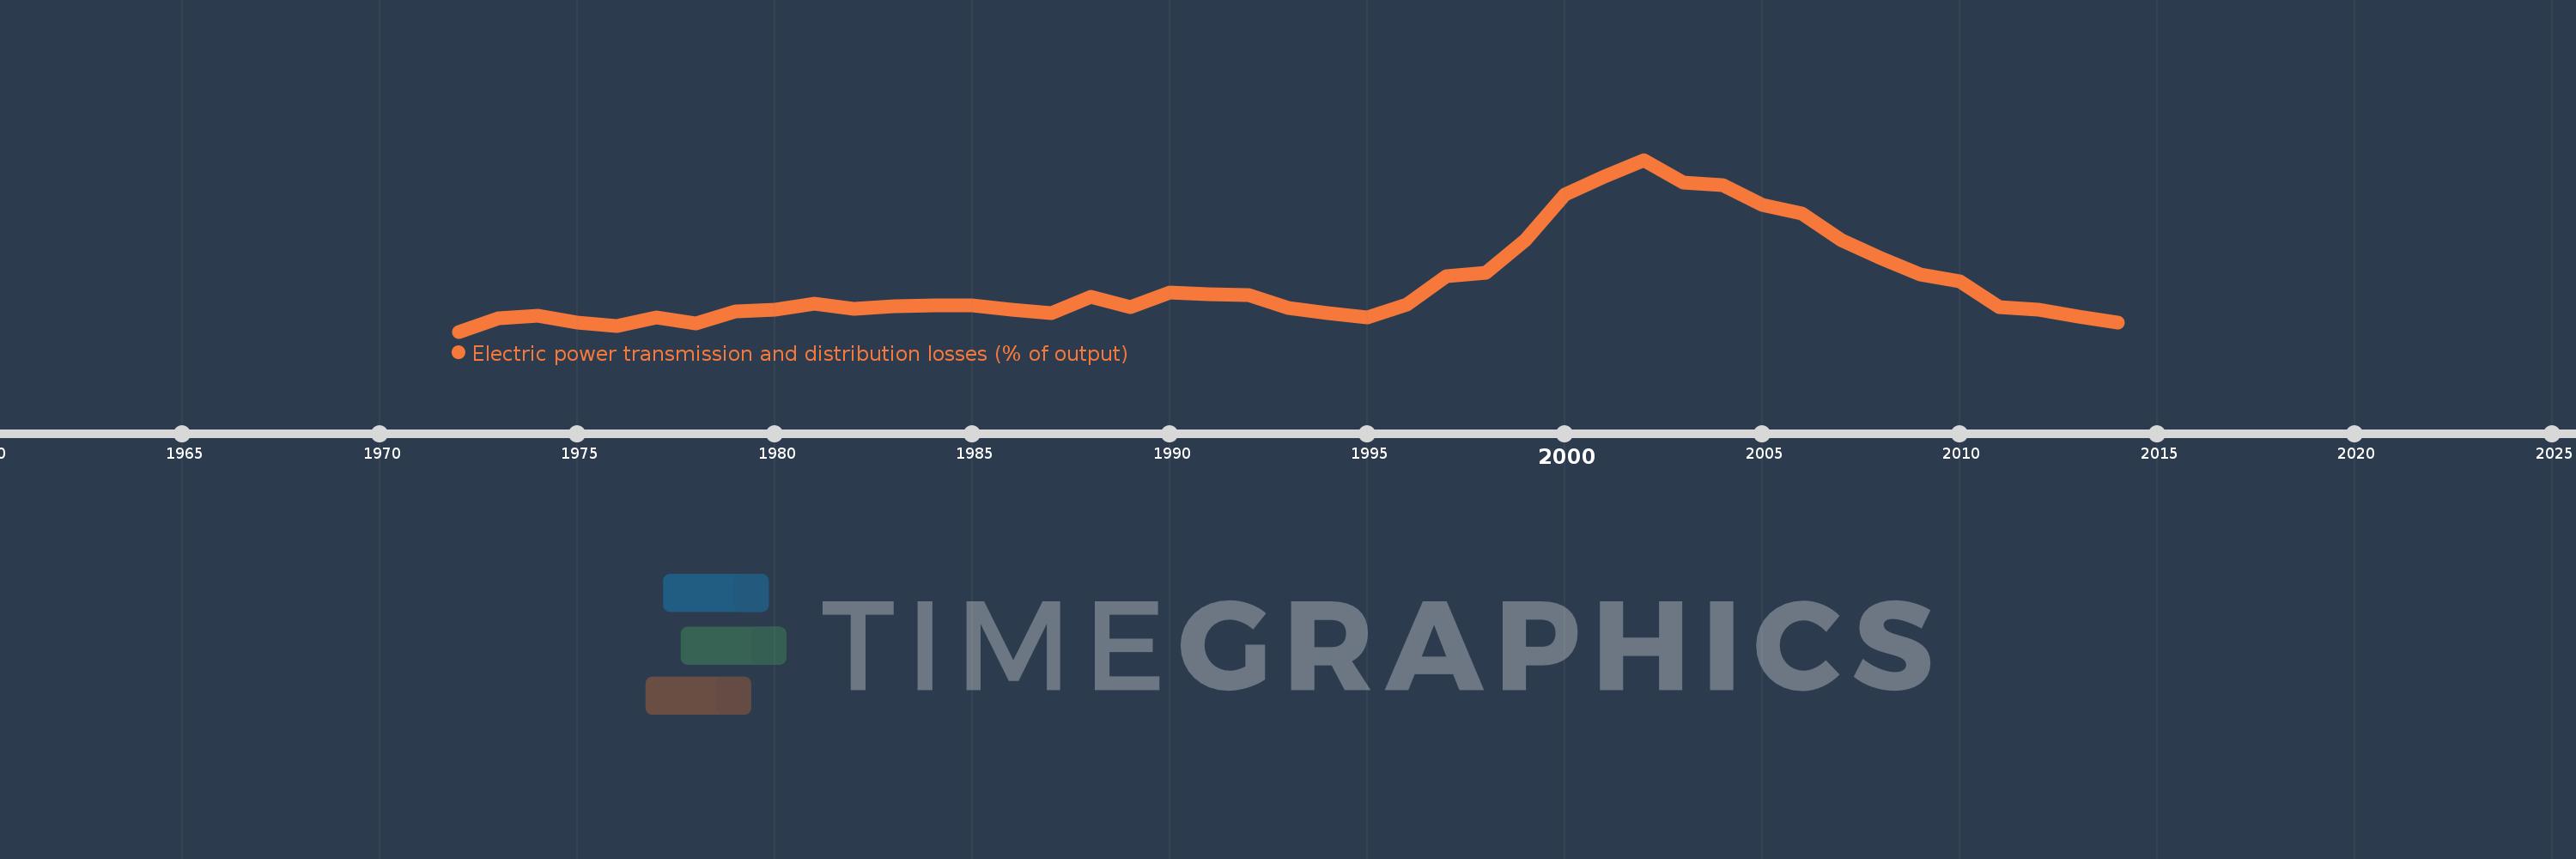
Electric power transmission and distribution losses (% of output)
2014,2013,2012,2011,2010,2009,2008,2007,2006,2005,2004,2003,2002,2001,2000,1999,1998,1997,1996,1995,1994,1993,1992,1991,1990,1989,1988,1987,1986,1985,1984,1983,1982,1981,1980,1979,1978,1977,1976,1975,1974,1973,1972
This statistics in other country:
AlbaniaAlgeriaAngolaArab WorldArgentinaArmeniaAustraliaAustriaAzerbaijanBahrainBangladeshBelarusBelgiumBeninBoliviaBosnia and HerzegovinaBotswanaBrazilBrunei DarussalamBulgariaCambodiaCameroonCanadaCaribbean small statesCentral Europe and the BalticsChileChinaColombiaCongo, Dem. Rep.Congo, Rep.Costa RicaCote d'IvoireCroatiaCubaCuracaoCyprusCzech RepublicDenmarkDominican RepublicEarly-demographic dividendEast Asia & PacificEast Asia & Pacific (excluding high income)East Asia & Pacific (IDA & IBRD countries)EcuadorEgypt, Arab Rep.El SalvadorEritreaEstoniaEthiopiaEuro areaEurope & Central AsiaEurope & Central Asia (excluding high income)Europe & Central Asia (IDA & IBRD countries)European UnionFinlandFragile and conflict affected situationsFranceGabonGeorgiaGermanyGhanaGibraltarGreeceGuatemalaHaitiHeavily indebted poor countries (HIPC)High incomeHondurasHong Kong SAR, ChinaHungaryIBRD onlyIcelandIDA & IBRD totalIDA blendIDA onlyIDA totalIndiaIndonesiaIran, Islamic Rep.IraqIrelandIsraelItalyJamaicaJapanJordanKazakhstanKenyaKorea, Dem. People’s Rep.Korea, Rep.KosovoKuwaitKyrgyz RepublicLate-demographic dividendLatin America & Caribbean Latin America & Caribbean (excluding high income)Latin America & the Caribbean (IDA & IBRD countries)LatviaLeast developed countries: UN classificationLebanonLibyaLithuaniaLow & middle incomeLow incomeLower middle incomeLuxembourgMacedonia, FYRMalaysiaMaltaMauritiusMexicoMiddle East & North AfricaMiddle East & North Africa (excluding high income)Middle East & North Africa (IDA & IBRD countries)Middle incomeMoldovaMongoliaMontenegroMoroccoMozambiqueMyanmarNamibiaNepalNetherlandsNew ZealandNicaraguaNigerNigeriaNorth AmericaNorwayOECD membersOmanOther small statesPakistanPanamaParaguayPeruPhilippinesPolandPortugalPost-demographic dividendPre-demographic dividendQatarRomaniaRussian FederationSaudi ArabiaSenegalSerbiaSingaporeSlovak RepublicSloveniaSmall statesSouth AfricaSouth AsiaSouth Asia (IDA & IBRD)South SudanSpainSri LankaSub-Saharan Africa Sub-Saharan Africa (excluding high income)Sub-Saharan Africa (IDA & IBRD countries)SudanSwedenSwitzerlandSyrian Arab RepublicTajikistanTanzaniaThailandTogoTrinidad and TobagoTunisiaTurkeyTurkmenistanUkraineUnited Arab EmiratesUnited KingdomUnited StatesUpper middle incomeUruguayUzbekistanVenezuela, RBVietnamWorldYemen, Rep.ZambiaZimbabwe Timeline:
This timeline shows a graph from 1972 to 2014 of South Asia (IDA & IBRD). No data until 1971. Number of actual observations by date: 43.
Source name:
World Development Indicators
Source organization:
IEA Statistics © OECD/IEA 2014 (http://www.iea.org/stats/index.asp), subject to https://www.iea.org/t&c/termsandconditions/
Categories, topics:
Energy & Mining, Infrastructure
Last updated:
apr 23, 2017
Indicators value changes by year
Maximum:
27.536
jan 1, 2002
At the date of observation
Value
Absolute change
Change from previous value
jan 1, 1972
17.57
+17.57
0.0%
jan 1, 1973
18.345
+0.775
4.41%
jan 1, 1974
18.47
+0.126
0.69%
jan 1, 1975
18.117
-0.354
-1.92%
jan 1, 1976
17.886
-0.231
-1.27%
jan 1, 1977
18.405
+0.519
2.9%
jan 1, 1978
18.042
-0.362
-1.97%
jan 1, 1979
18.726
+0.683
3.79%
jan 1, 1980
18.831
+0.105
0.56%
jan 1, 1981
19.195
+0.364
1.93%
jan 1, 1982
18.879
-0.316
-1.65%
jan 1, 1983
19.041
+0.163
0.86%
jan 1, 1984
19.095
+0.054
0.28%
jan 1, 1985
19.095
0.0
0.0%
jan 1, 1986
18.859
-0.236
-1.24%
jan 1, 1987
18.631
-0.228
-1.21%
jan 1, 1988
19.596
+0.966
5.18%
jan 1, 1989
19.001
-0.595
-3.04%
jan 1, 1990
19.827
+0.826
4.34%
jan 1, 1991
19.762
-0.065
-0.33%
jan 1, 1992
19.664
-0.097
-0.49%
jan 1, 1993
18.919
-0.745
-3.79%
jan 1, 1994
18.621
-0.298
-1.57%
jan 1, 1995
18.392
-0.229
-1.23%
jan 1, 1996
19.15
+0.757
4.12%
jan 1, 1997
20.76
+1.61
8.41%
jan 1, 1998
21.008
+0.248
1.19%
jan 1, 1999
22.871
+1.864
8.87%
jan 1, 2000
25.503
+2.631
11.51%
jan 1, 2001
26.552
+1.05
4.12%
jan 1, 2002
27.536
+0.984
3.71%
jan 1, 2003
26.191
-1.345
-4.89%
jan 1, 2004
26.08
-0.111
-0.42%
jan 1, 2005
24.924
-1.156
-4.43%
jan 1, 2006
24.398
-0.527
-2.11%
jan 1, 2007
22.884
-1.514
-6.2%
jan 1, 2008
21.836
-1.048
-4.58%
jan 1, 2009
20.908
-0.927
-4.25%
jan 1, 2010
20.496
-0.412
-1.97%
jan 1, 2011
19.011
-1.485
-7.25%
jan 1, 2012
18.835
-0.176
-0.93%
jan 1, 2013
18.441
-0.395
-2.1%
jan 1, 2014
18.107
-0.333
-1.81%
Ranking of countries by current statistics by years


Comments: