29
/
en
AIzaSyAYiBZKx7MnpbEhh9jyipgxe19OcubqV5w
April 1, 2024
65876
Algeria
DZA
true
2
1
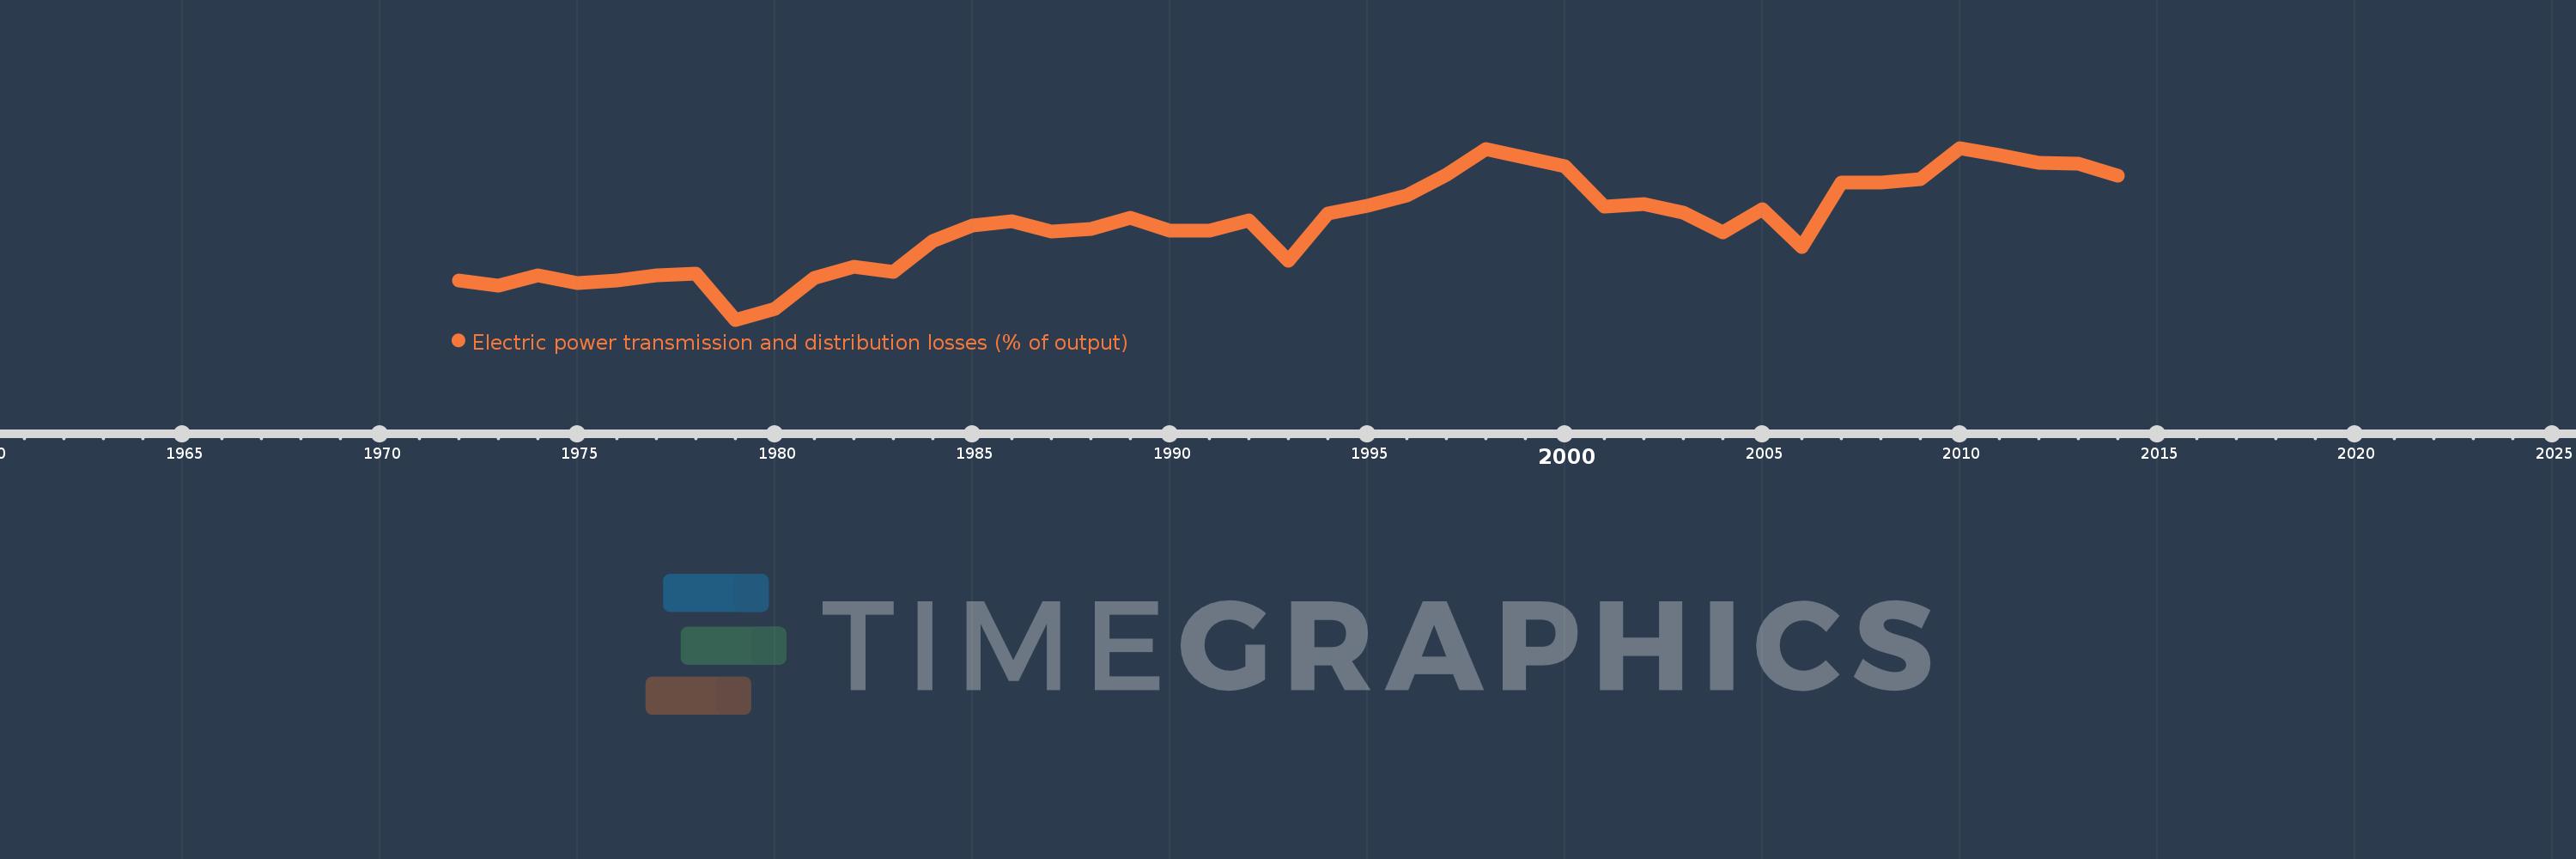
Electric power transmission and distribution losses (% of output)
2014,2013,2012,2011,2010,2009,2008,2007,2006,2005,2004,2003,2002,2001,2000,1999,1998,1997,1996,1995,1994,1993,1992,1991,1990,1989,1988,1987,1986,1985,1984,1983,1982,1981,1980,1979,1978,1977,1976,1975,1974,1973,1972
This statistics in other country:
AlbaniaAlgeriaAngolaArab WorldArgentinaArmeniaAustraliaAustriaAzerbaijanBahrainBangladeshBelarusBelgiumBeninBoliviaBosnia and HerzegovinaBotswanaBrazilBrunei DarussalamBulgariaCambodiaCameroonCanadaCaribbean small statesCentral Europe and the BalticsChileChinaColombiaCongo, Dem. Rep.Congo, Rep.Costa RicaCote d'IvoireCroatiaCubaCuracaoCyprusCzech RepublicDenmarkDominican RepublicEarly-demographic dividendEast Asia & PacificEast Asia & Pacific (excluding high income)East Asia & Pacific (IDA & IBRD countries)EcuadorEgypt, Arab Rep.El SalvadorEritreaEstoniaEthiopiaEuro areaEurope & Central AsiaEurope & Central Asia (excluding high income)Europe & Central Asia (IDA & IBRD countries)European UnionFinlandFragile and conflict affected situationsFranceGabonGeorgiaGermanyGhanaGibraltarGreeceGuatemalaHaitiHeavily indebted poor countries (HIPC)High incomeHondurasHong Kong SAR, ChinaHungaryIBRD onlyIcelandIDA & IBRD totalIDA blendIDA onlyIDA totalIndiaIndonesiaIran, Islamic Rep.IraqIrelandIsraelItalyJamaicaJapanJordanKazakhstanKenyaKorea, Dem. People’s Rep.Korea, Rep.KosovoKuwaitKyrgyz RepublicLate-demographic dividendLatin America & Caribbean Latin America & Caribbean (excluding high income)Latin America & the Caribbean (IDA & IBRD countries)LatviaLeast developed countries: UN classificationLebanonLibyaLithuaniaLow & middle incomeLow incomeLower middle incomeLuxembourgMacedonia, FYRMalaysiaMaltaMauritiusMexicoMiddle East & North AfricaMiddle East & North Africa (excluding high income)Middle East & North Africa (IDA & IBRD countries)Middle incomeMoldovaMongoliaMontenegroMoroccoMozambiqueMyanmarNamibiaNepalNetherlandsNew ZealandNicaraguaNigerNigeriaNorth AmericaNorwayOECD membersOmanOther small statesPakistanPanamaParaguayPeruPhilippinesPolandPortugalPost-demographic dividendPre-demographic dividendQatarRomaniaRussian FederationSaudi ArabiaSenegalSerbiaSingaporeSlovak RepublicSloveniaSmall statesSouth AfricaSouth AsiaSouth Asia (IDA & IBRD)South SudanSpainSri LankaSub-Saharan Africa Sub-Saharan Africa (excluding high income)Sub-Saharan Africa (IDA & IBRD countries)SudanSwedenSwitzerlandSyrian Arab RepublicTajikistanTanzaniaThailandTogoTrinidad and TobagoTunisiaTurkeyTurkmenistanUkraineUnited Arab EmiratesUnited KingdomUnited StatesUpper middle incomeUruguayUzbekistanVenezuela, RBVietnamWorldYemen, Rep.ZambiaZimbabwe Timeline:
This timeline shows a graph from 1972 to 2014 of Algeria. No data until 1971. Number of actual observations by date: 43.
Source name:
World Development Indicators
Source organization:
IEA Statistics © OECD/IEA 2014 (http://www.iea.org/stats/index.asp), subject to https://www.iea.org/t&c/termsandconditions/
Categories, topics:
Energy & Mining, Infrastructure
Last updated:
apr 23, 2017
Indicators value changes by year
Maximum:
20.412
jan 1, 2010
At the date of observation
Value
Absolute change
Change from previous value
jan 1, 1972
10.722
+10.722
0.0%
jan 1, 1973
10.386
-0.336
-3.14%
jan 1, 1974
11.083
+0.698
6.72%
jan 1, 1975
10.528
-0.555
-5.01%
jan 1, 1976
10.744
+0.216
2.05%
jan 1, 1977
11.122
+0.378
3.52%
jan 1, 1978
11.238
+0.117
1.05%
jan 1, 1979
7.865
-3.373
-30.02%
jan 1, 1980
8.664
+0.799
10.16%
jan 1, 1981
10.908
+2.244
25.91%
jan 1, 1982
11.717
+0.809
7.41%
jan 1, 1983
11.335
-0.382
-3.26%
jan 1, 1984
13.603
+2.269
20.02%
jan 1, 1985
14.747
+1.143
8.41%
jan 1, 1986
15.04
+0.293
1.99%
jan 1, 1987
14.282
-0.758
-5.04%
jan 1, 1988
14.502
+0.22
1.54%
jan 1, 1989
15.287
+0.785
5.41%
jan 1, 1990
14.357
-0.931
-6.09%
jan 1, 1991
14.363
+0.006
0.04%
jan 1, 1992
15.128
+0.765
5.33%
jan 1, 1993
12.184
-2.944
-19.46%
jan 1, 1994
15.602
+3.418
28.05%
jan 1, 1995
16.165
+0.562
3.6%
jan 1, 1996
16.941
+0.777
4.81%
jan 1, 1997
18.471
+1.53
9.03%
jan 1, 1998
20.342
+1.871
10.13%
jan 1, 1999
19.693
-0.649
-3.19%
jan 1, 2000
19.106
-0.587
-2.98%
jan 1, 2001
16.154
-2.952
-15.45%
jan 1, 2002
16.289
+0.135
0.84%
jan 1, 2003
15.719
-0.57
-3.5%
jan 1, 2004
14.234
-1.485
-9.45%
jan 1, 2005
15.923
+1.69
11.87%
jan 1, 2006
13.195
-2.728
-17.14%
jan 1, 2007
17.87
+4.676
35.44%
jan 1, 2008
17.87
0.0
0.0%
jan 1, 2009
18.111
+0.24
1.35%
jan 1, 2010
20.412
+2.302
12.71%
jan 1, 2011
19.878
-0.534
-2.62%
jan 1, 2012
19.325
-0.553
-2.78%
jan 1, 2013
19.283
-0.042
-0.22%
jan 1, 2014
18.405
-0.878
-4.55%
Ranking of countries by current statistics by years


Comments: