29
/
en
AIzaSyAYiBZKx7MnpbEhh9jyipgxe19OcubqV5w
April 1, 2024
53331
Other small states
OSS
false
2
1
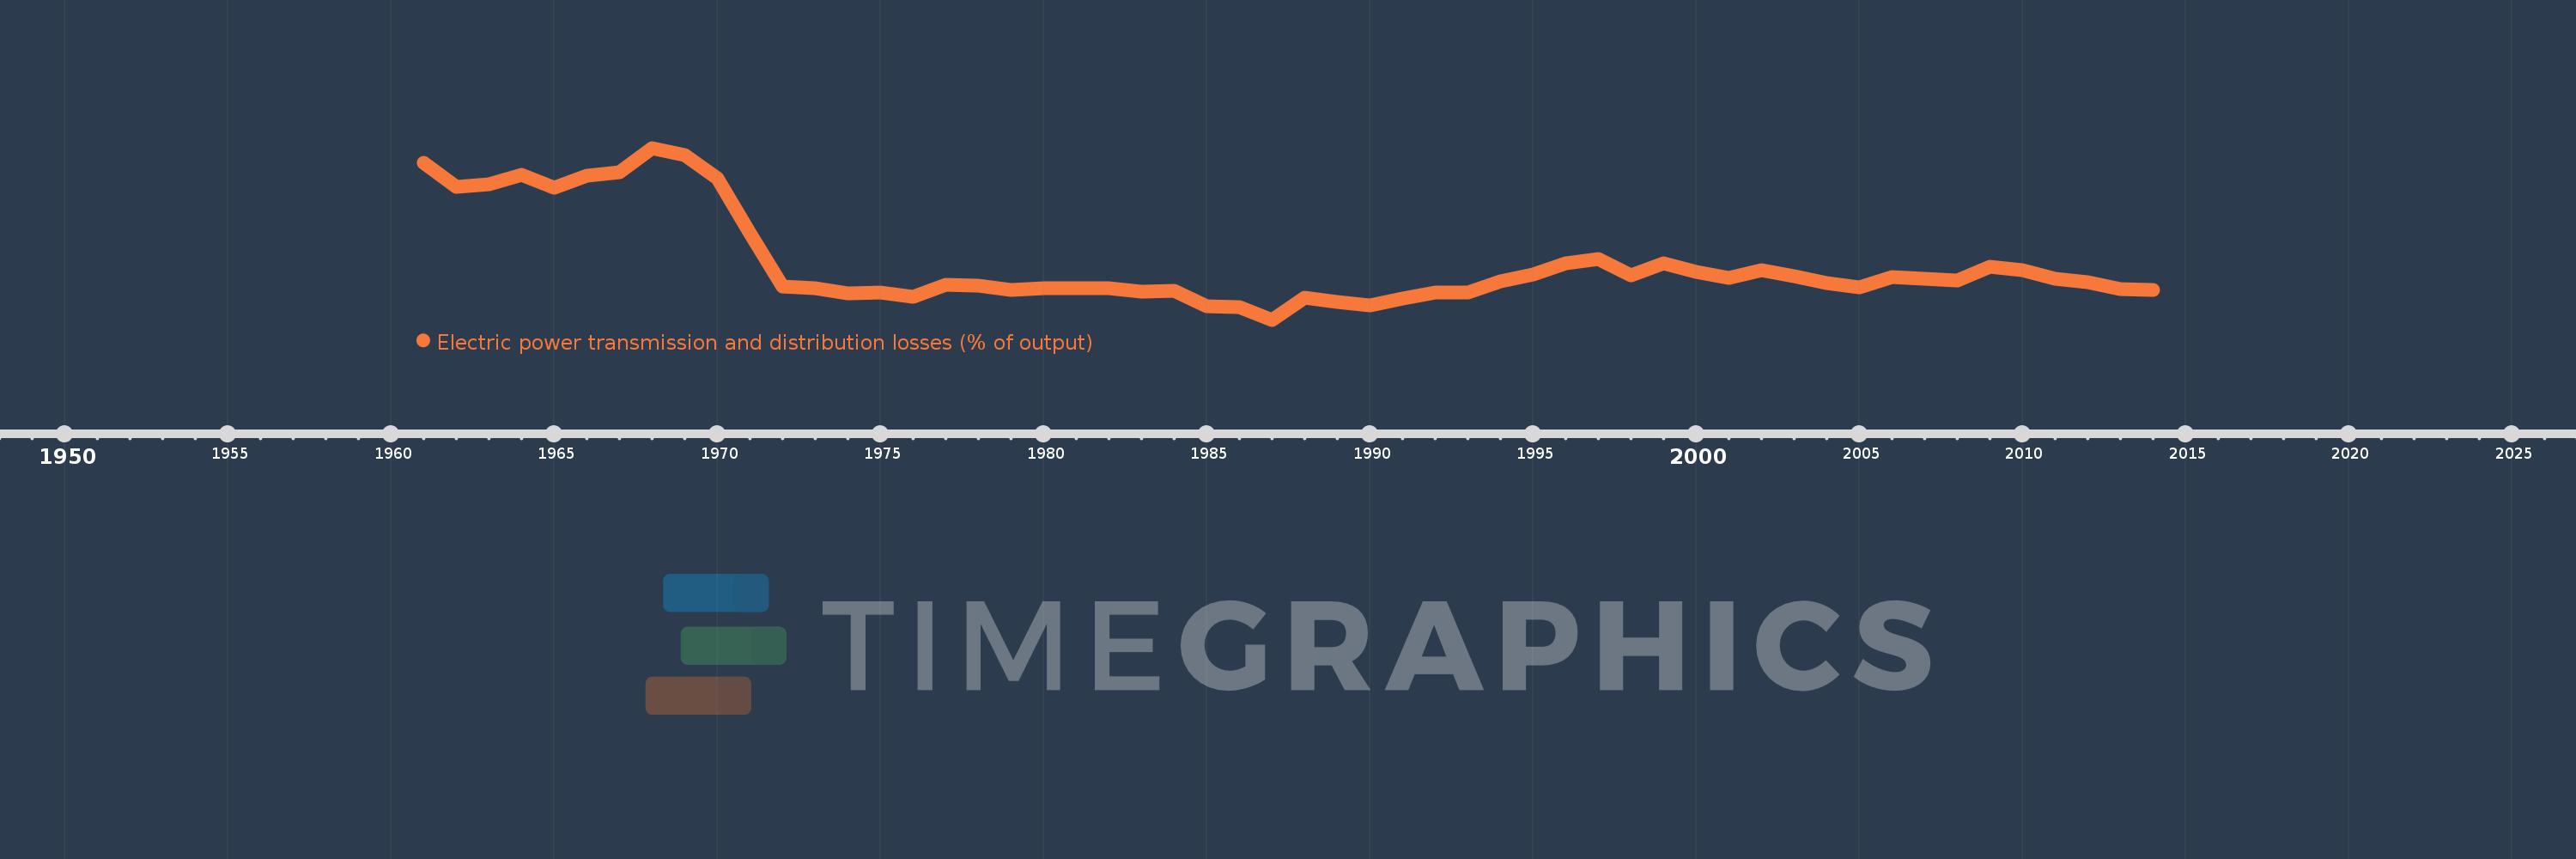
Electric power transmission and distribution losses (% of output)
2014,2013,2012,2011,2010,2009,2008,2007,2006,2005,2004,2003,2002,2001,2000,1999,1998,1997,1996,1995,1994,1993,1992,1991,1990,1989,1988,1987,1986,1985,1984,1983,1982,1981,1980,1979,1978,1977,1976,1975,1974,1973,1972,1971,1970,1969,1968,1967,1966,1965,1964,1963,1962,1961
This statistics in other country:
AlbaniaAlgeriaAngolaArab WorldArgentinaArmeniaAustraliaAustriaAzerbaijanBahrainBangladeshBelarusBelgiumBeninBoliviaBosnia and HerzegovinaBotswanaBrazilBrunei DarussalamBulgariaCambodiaCameroonCanadaCaribbean small statesCentral Europe and the BalticsChileChinaColombiaCongo, Dem. Rep.Congo, Rep.Costa RicaCote d'IvoireCroatiaCubaCuracaoCyprusCzech RepublicDenmarkDominican RepublicEarly-demographic dividendEast Asia & PacificEast Asia & Pacific (excluding high income)East Asia & Pacific (IDA & IBRD countries)EcuadorEgypt, Arab Rep.El SalvadorEritreaEstoniaEthiopiaEuro areaEurope & Central AsiaEurope & Central Asia (excluding high income)Europe & Central Asia (IDA & IBRD countries)European UnionFinlandFragile and conflict affected situationsFranceGabonGeorgiaGermanyGhanaGibraltarGreeceGuatemalaHaitiHeavily indebted poor countries (HIPC)High incomeHondurasHong Kong SAR, ChinaHungaryIBRD onlyIcelandIDA & IBRD totalIDA blendIDA onlyIDA totalIndiaIndonesiaIran, Islamic Rep.IraqIrelandIsraelItalyJamaicaJapanJordanKazakhstanKenyaKorea, Dem. People’s Rep.Korea, Rep.KosovoKuwaitKyrgyz RepublicLate-demographic dividendLatin America & Caribbean Latin America & Caribbean (excluding high income)Latin America & the Caribbean (IDA & IBRD countries)LatviaLeast developed countries: UN classificationLebanonLibyaLithuaniaLow & middle incomeLow incomeLower middle incomeLuxembourgMacedonia, FYRMalaysiaMaltaMauritiusMexicoMiddle East & North AfricaMiddle East & North Africa (excluding high income)Middle East & North Africa (IDA & IBRD countries)Middle incomeMoldovaMongoliaMontenegroMoroccoMozambiqueMyanmarNamibiaNepalNetherlandsNew ZealandNicaraguaNigerNigeriaNorth AmericaNorwayOECD membersOmanOther small statesPakistanPanamaParaguayPeruPhilippinesPolandPortugalPost-demographic dividendPre-demographic dividendQatarRomaniaRussian FederationSaudi ArabiaSenegalSerbiaSingaporeSlovak RepublicSloveniaSmall statesSouth AfricaSouth AsiaSouth Asia (IDA & IBRD)South SudanSpainSri LankaSub-Saharan Africa Sub-Saharan Africa (excluding high income)Sub-Saharan Africa (IDA & IBRD countries)SudanSwedenSwitzerlandSyrian Arab RepublicTajikistanTanzaniaThailandTogoTrinidad and TobagoTunisiaTurkeyTurkmenistanUkraineUnited Arab EmiratesUnited KingdomUnited StatesUpper middle incomeUruguayUzbekistanVenezuela, RBVietnamWorldYemen, Rep.ZambiaZimbabwe Timeline:
This timeline shows a graph from 1961 to 2014 of Other small states. No data until 1960. Number of actual observations by date: 54.
Source name:
World Development Indicators
Source organization:
IEA Statistics © OECD/IEA 2014 (http://www.iea.org/stats/index.asp), subject to https://www.iea.org/t&c/termsandconditions/
Categories, topics:
Energy & Mining, Infrastructure
Last updated:
apr 23, 2017
Indicators value changes by year
Maximum:
17.847
jan 1, 1968
At the date of observation
Value
Absolute change
Change from previous value
jan 1, 1961
16.697
+16.697
0.0%
jan 1, 1962
14.76
-1.937
-11.6%
jan 1, 1963
14.976
+0.216
1.47%
jan 1, 1964
15.701
+0.725
4.84%
jan 1, 1965
14.684
-1.017
-6.48%
jan 1, 1966
15.634
+0.95
6.47%
jan 1, 1967
15.929
+0.295
1.89%
jan 1, 1968
17.847
+1.918
12.04%
jan 1, 1969
17.284
-0.563
-3.16%
jan 1, 1970
15.444
-1.84
-10.65%
jan 1, 1971
11.089
-4.355
-28.2%
jan 1, 1972
6.939
-4.15
-37.43%
jan 1, 1973
6.757
-0.182
-2.62%
jan 1, 1974
6.358
-0.399
-5.91%
jan 1, 1975
6.411
+0.053
0.83%
jan 1, 1976
6.078
-0.333
-5.19%
jan 1, 1977
7.043
+0.965
15.87%
jan 1, 1978
6.998
-0.046
-0.65%
jan 1, 1979
6.669
-0.328
-4.69%
jan 1, 1980
6.775
+0.105
1.58%
jan 1, 1981
6.797
+0.022
0.33%
jan 1, 1982
6.76
-0.037
-0.54%
jan 1, 1983
6.488
-0.271
-4.02%
jan 1, 1984
6.594
+0.106
1.63%
jan 1, 1985
5.358
-1.237
-18.75%
jan 1, 1986
5.278
-0.08
-1.49%
jan 1, 1987
4.29
-0.987
-18.71%
jan 1, 1988
6.026
+1.736
40.46%
jan 1, 1989
5.706
-0.32
-5.3%
jan 1, 1990
5.443
-0.263
-4.61%
jan 1, 1991
5.972
+0.529
9.72%
jan 1, 1992
6.462
+0.489
8.19%
jan 1, 1993
6.438
-0.024
-0.37%
jan 1, 1994
7.33
+0.893
13.86%
jan 1, 1995
7.829
+0.499
6.8%
jan 1, 1996
8.735
+0.907
11.58%
jan 1, 1997
9.113
+0.378
4.33%
jan 1, 1998
7.808
-1.306
-14.33%
jan 1, 1999
8.765
+0.957
12.26%
jan 1, 2000
8.062
-0.703
-8.02%
jan 1, 2001
7.607
-0.455
-5.64%
jan 1, 2002
8.178
+0.57
7.5%
jan 1, 2003
7.722
-0.455
-5.57%
jan 1, 2004
7.158
-0.565
-7.32%
jan 1, 2005
6.879
-0.278
-3.89%
jan 1, 2006
7.627
+0.748
10.87%
jan 1, 2007
7.498
-0.129
-1.69%
jan 1, 2008
7.38
-0.118
-1.58%
jan 1, 2009
8.44
+1.06
14.37%
jan 1, 2010
8.209
-0.23
-2.73%
jan 1, 2011
7.534
-0.675
-8.23%
jan 1, 2012
7.228
-0.306
-4.06%
jan 1, 2013
6.689
-0.539
-7.45%
jan 1, 2014
6.663
-0.027
-0.4%
Ranking of countries by current statistics by years


Comments: