29
/
en
AIzaSyAYiBZKx7MnpbEhh9jyipgxe19OcubqV5w
April 1, 2024
39835
IDA total
IDA
false
2
1
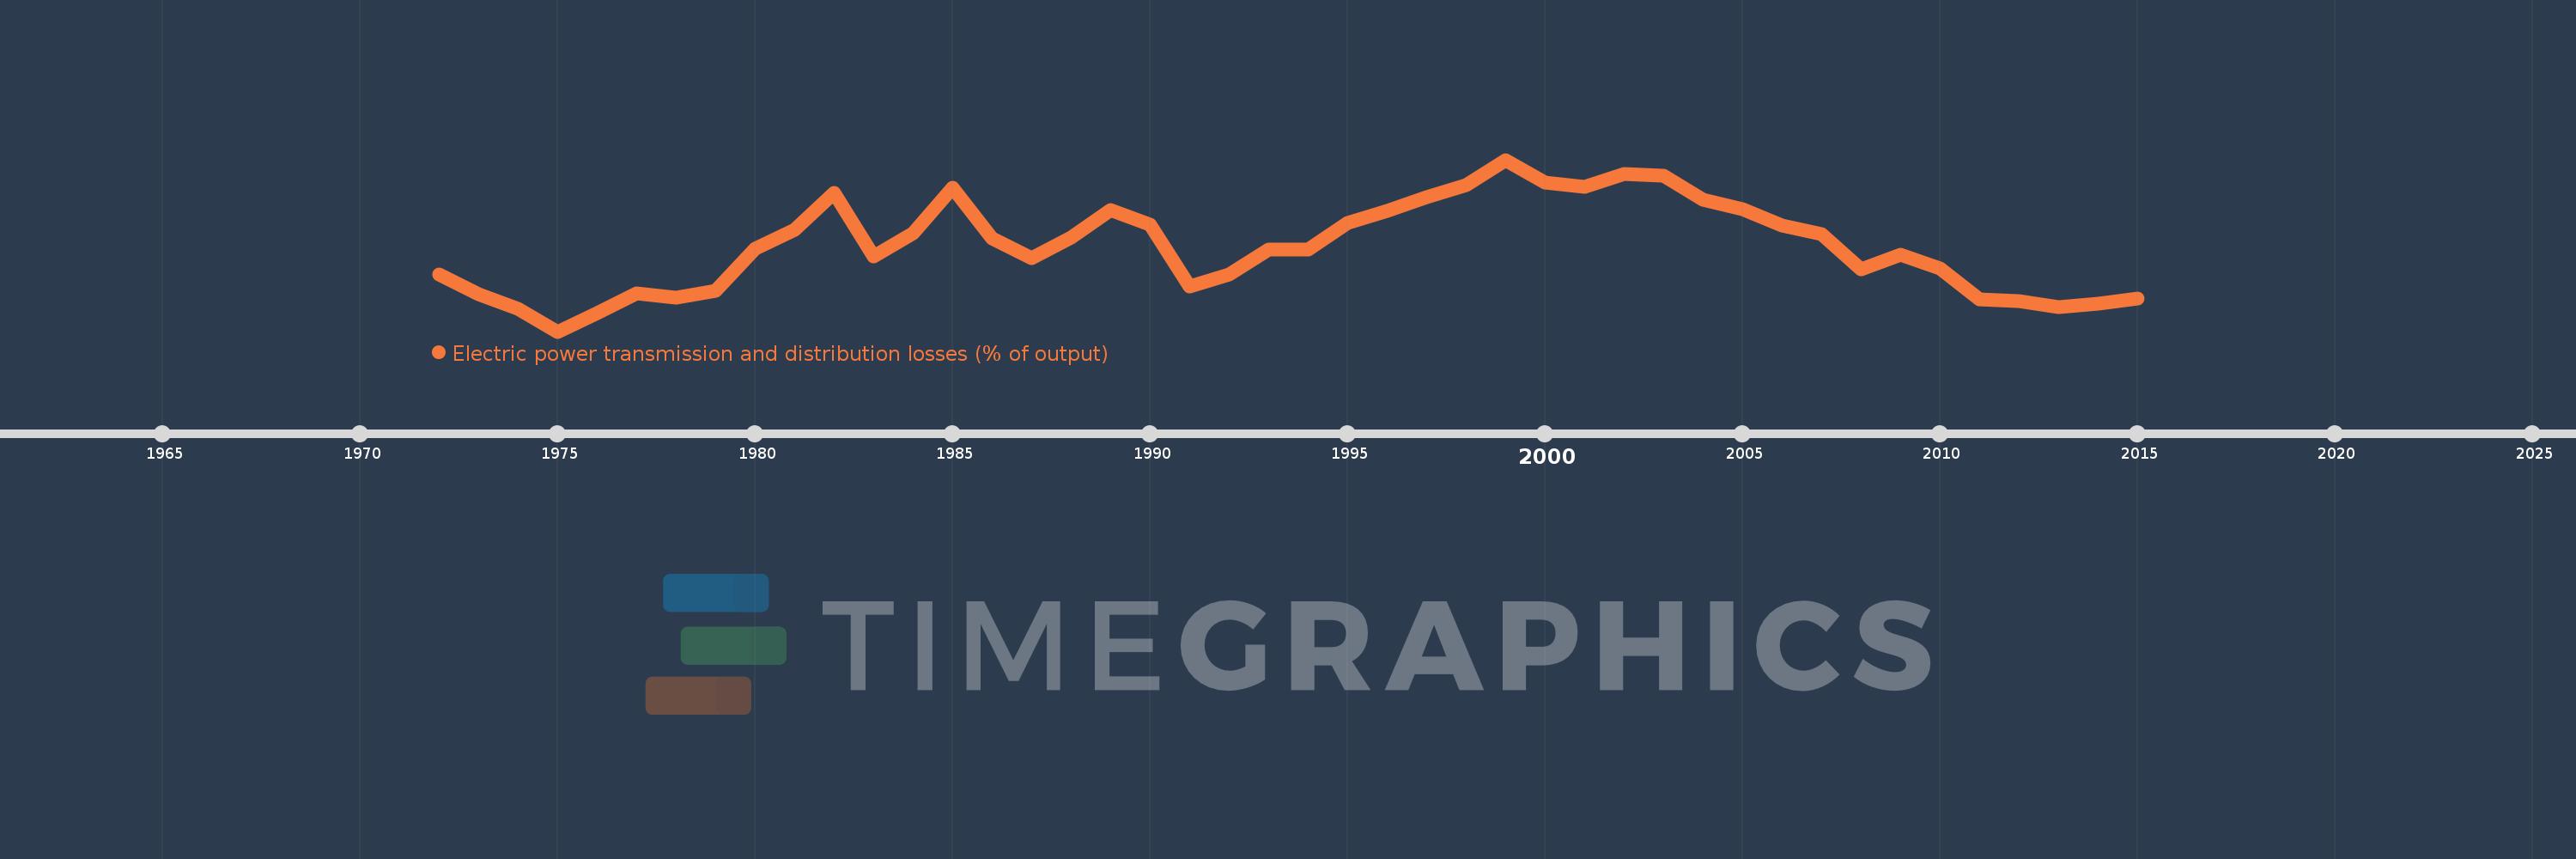
Electric power transmission and distribution losses (% of output)
2015,2014,2013,2012,2011,2010,2009,2008,2007,2006,2005,2004,2003,2002,2001,2000,1999,1998,1997,1996,1995,1994,1993,1992,1991,1990,1989,1988,1987,1986,1985,1984,1983,1982,1981,1980,1979,1978,1977,1976,1975,1974,1973,1972
This statistics in other country:
AlbaniaAlgeriaAngolaArab WorldArgentinaArmeniaAustraliaAustriaAzerbaijanBahrainBangladeshBelarusBelgiumBeninBoliviaBosnia and HerzegovinaBotswanaBrazilBrunei DarussalamBulgariaCambodiaCameroonCanadaCaribbean small statesCentral Europe and the BalticsChileChinaColombiaCongo, Dem. Rep.Congo, Rep.Costa RicaCote d'IvoireCroatiaCubaCuracaoCyprusCzech RepublicDenmarkDominican RepublicEarly-demographic dividendEast Asia & PacificEast Asia & Pacific (excluding high income)East Asia & Pacific (IDA & IBRD countries)EcuadorEgypt, Arab Rep.El SalvadorEritreaEstoniaEthiopiaEuro areaEurope & Central AsiaEurope & Central Asia (excluding high income)Europe & Central Asia (IDA & IBRD countries)European UnionFinlandFragile and conflict affected situationsFranceGabonGeorgiaGermanyGhanaGibraltarGreeceGuatemalaHaitiHeavily indebted poor countries (HIPC)High incomeHondurasHong Kong SAR, ChinaHungaryIBRD onlyIcelandIDA & IBRD totalIDA blendIDA onlyIDA totalIndiaIndonesiaIran, Islamic Rep.IraqIrelandIsraelItalyJamaicaJapanJordanKazakhstanKenyaKorea, Dem. People’s Rep.Korea, Rep.KosovoKuwaitKyrgyz RepublicLate-demographic dividendLatin America & Caribbean Latin America & Caribbean (excluding high income)Latin America & the Caribbean (IDA & IBRD countries)LatviaLeast developed countries: UN classificationLebanonLibyaLithuaniaLow & middle incomeLow incomeLower middle incomeLuxembourgMacedonia, FYRMalaysiaMaltaMauritiusMexicoMiddle East & North AfricaMiddle East & North Africa (excluding high income)Middle East & North Africa (IDA & IBRD countries)Middle incomeMoldovaMongoliaMontenegroMoroccoMozambiqueMyanmarNamibiaNepalNetherlandsNew ZealandNicaraguaNigerNigeriaNorth AmericaNorwayOECD membersOmanOther small statesPakistanPanamaParaguayPeruPhilippinesPolandPortugalPost-demographic dividendPre-demographic dividendQatarRomaniaRussian FederationSaudi ArabiaSenegalSerbiaSingaporeSlovak RepublicSloveniaSmall statesSouth AfricaSouth AsiaSouth Asia (IDA & IBRD)South SudanSpainSri LankaSub-Saharan Africa Sub-Saharan Africa (excluding high income)Sub-Saharan Africa (IDA & IBRD countries)SudanSwedenSwitzerlandSyrian Arab RepublicTajikistanTanzaniaThailandTogoTrinidad and TobagoTunisiaTurkeyTurkmenistanUkraineUnited Arab EmiratesUnited KingdomUnited StatesUpper middle incomeUruguayUzbekistanVenezuela, RBVietnamWorldYemen, Rep.ZambiaZimbabwe Timeline:
This timeline shows a graph from 1972 to 2015 of IDA total. No data until 1971. Number of actual observations by date: 44.
Source name:
World Development Indicators
Source organization:
IEA Statistics © OECD/IEA 2014 (http://www.iea.org/stats/index.asp), subject to https://www.iea.org/t&c/termsandconditions/
Categories, topics:
Energy & Mining, Infrastructure
Last updated:
apr 23, 2017
Indicators value changes by year
Minimum:
13.115
jan 1, 1975
Maximum:
20.891
jan 1, 1999
At the date of observation
Value
Absolute change
Change from previous value
jan 1, 1972
15.692
+15.692
0.0%
jan 1, 1973
14.812
-0.881
-5.61%
jan 1, 1974
14.152
-0.66
-4.45%
jan 1, 1975
13.115
-1.037
-7.33%
jan 1, 1976
13.951
+0.836
6.38%
jan 1, 1977
14.834
+0.883
6.33%
jan 1, 1978
14.635
-0.2
-1.35%
jan 1, 1979
14.976
+0.341
2.33%
jan 1, 1980
16.872
+1.896
12.66%
jan 1, 1981
17.72
+0.848
5.03%
jan 1, 1982
19.395
+1.675
9.45%
jan 1, 1983
16.535
-2.86
-14.75%
jan 1, 1984
17.574
+1.039
6.29%
jan 1, 1985
19.622
+2.048
11.66%
jan 1, 1986
17.318
-2.304
-11.74%
jan 1, 1987
16.458
-0.86
-4.97%
jan 1, 1988
17.374
+0.916
5.56%
jan 1, 1989
18.63
+1.256
7.23%
jan 1, 1990
17.947
-0.683
-3.67%
jan 1, 1991
15.164
-2.782
-15.5%
jan 1, 1992
15.69
+0.526
3.47%
jan 1, 1993
16.828
+1.138
7.25%
jan 1, 1994
16.834
+0.006
0.03%
jan 1, 1995
18.026
+1.193
7.08%
jan 1, 1996
18.588
+0.562
3.12%
jan 1, 1997
19.181
+0.593
3.19%
jan 1, 1998
19.747
+0.566
2.95%
jan 1, 1999
20.891
+1.144
5.79%
jan 1, 2000
19.861
-1.03
-4.93%
jan 1, 2001
19.685
-0.175
-0.88%
jan 1, 2002
20.266
+0.581
2.95%
jan 1, 2003
20.159
-0.108
-0.53%
jan 1, 2004
19.067
-1.092
-5.41%
jan 1, 2005
18.642
-0.426
-2.23%
jan 1, 2006
17.931
-0.711
-3.81%
jan 1, 2007
17.52
-0.411
-2.29%
jan 1, 2008
15.922
-1.597
-9.12%
jan 1, 2009
16.59
+0.668
4.2%
jan 1, 2010
15.989
-0.602
-3.63%
jan 1, 2011
14.586
-1.403
-8.77%
jan 1, 2012
14.489
-0.096
-0.66%
jan 1, 2013
14.239
-0.25
-1.73%
jan 1, 2014
14.371
+0.132
0.93%
jan 1, 2015
14.629
+0.258
1.79%
Ranking of countries by current statistics by years


Comments: