29
/
en
AIzaSyAYiBZKx7MnpbEhh9jyipgxe19OcubqV5w
April 1, 2024
54481
Pacific island small states
PSS
false
2
1
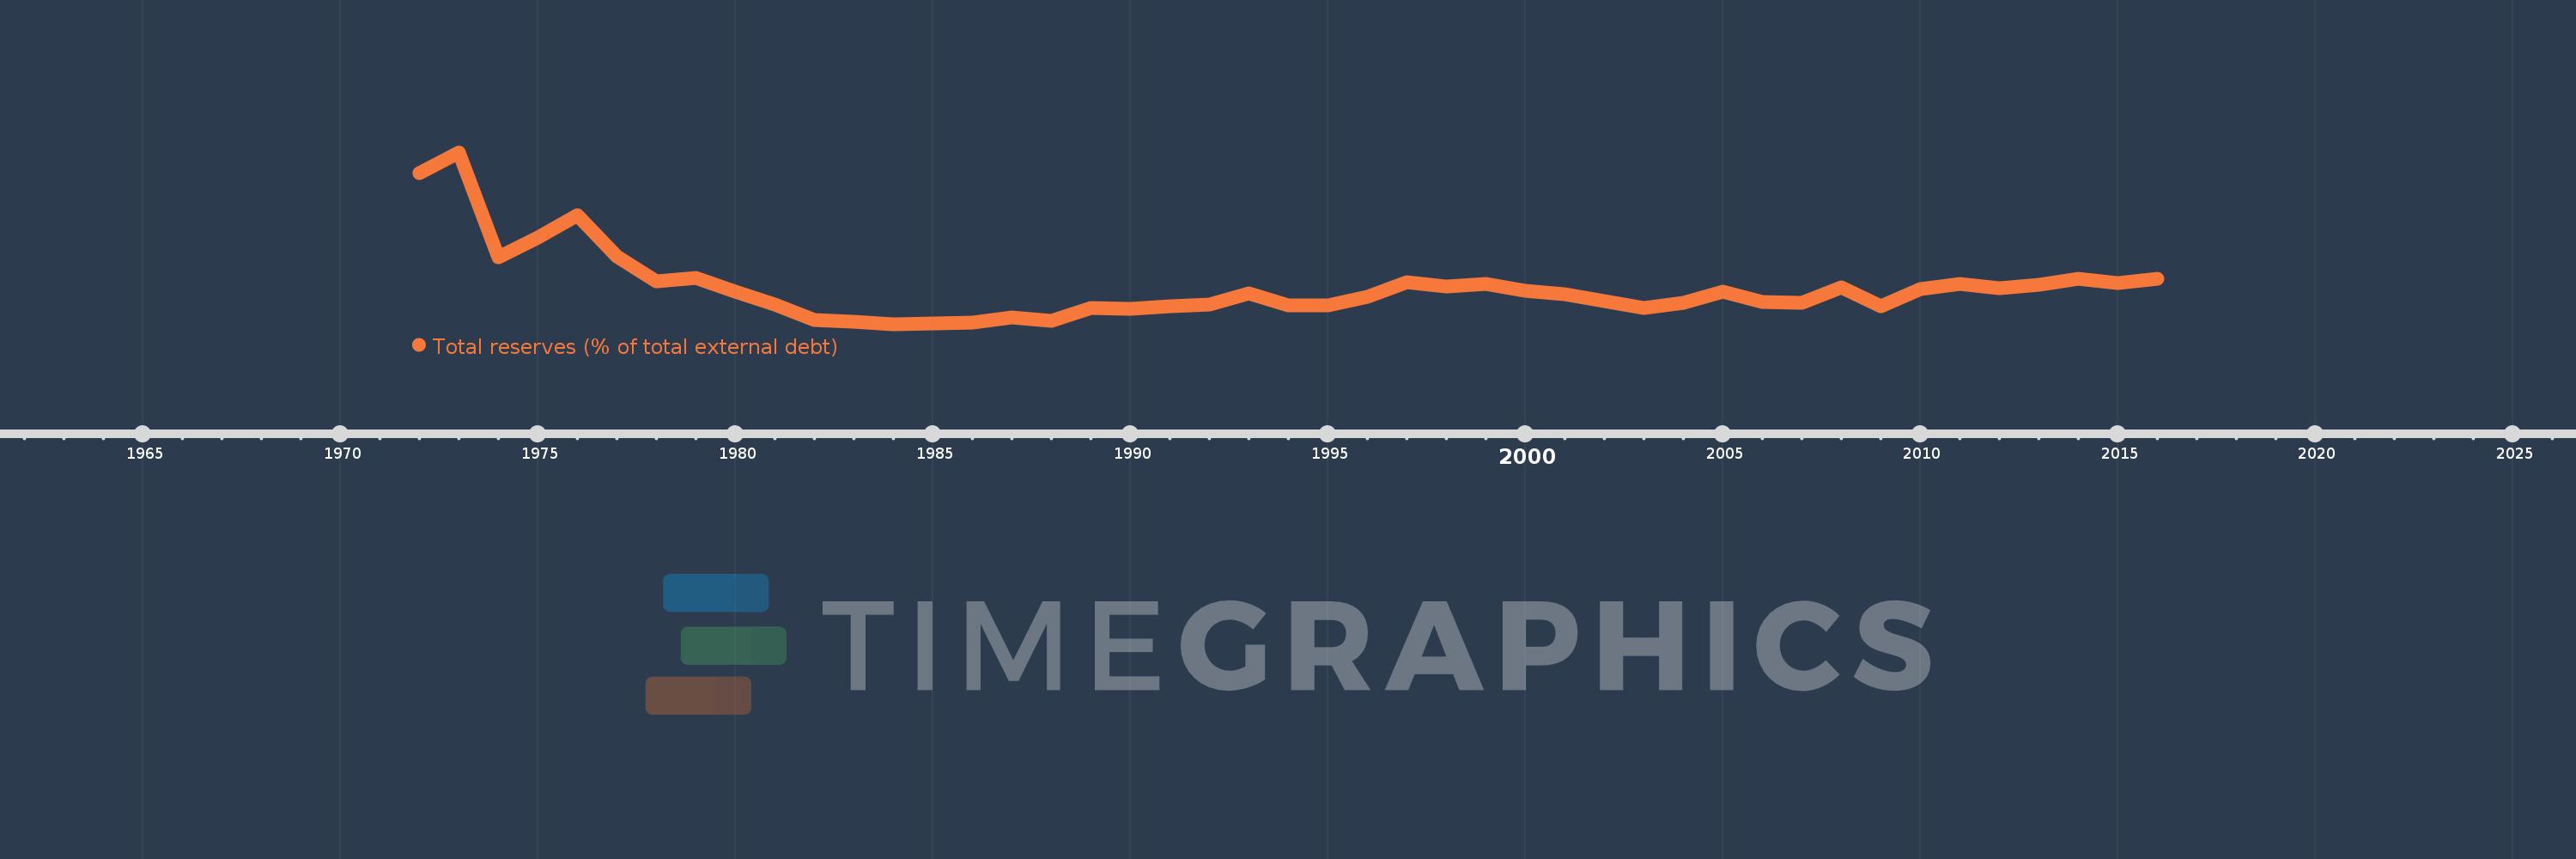
Total reserves (% of total external debt)
2016,2015,2014,2013,2012,2011,2010,2009,2008,2007,2006,2005,2004,2003,2002,2001,2000,1999,1998,1997,1996,1995,1994,1993,1992,1991,1990,1989,1988,1987,1986,1985,1984,1983,1982,1981,1980,1979,1978,1977,1976,1975,1974,1973,1972
This statistics in other country:
Timeline:
This timeline shows a graph from 1972 to 2016 of Pacific island small states. No data until 1971. Number of actual observations by date: 45.
Source name:
World Development Indicators
Source organization:
World Bank, International Debt Statistics.
Categories, topics:
Financial Sector, External Debt
Last updated:
apr 23, 2017
Indicators value changes by year
Minimum:
40.715
jan 1, 1984
Maximum:
294.575
jan 1, 1973
At the date of observation
Value
Absolute change
Change from previous value
jan 1, 1972
264.195
+264.195
0.0%
jan 1, 1973
294.575
+30.381
11.5%
jan 1, 1974
139.488
-155.087
-52.65%
jan 1, 1975
168.517
+29.028
20.81%
jan 1, 1976
202.076
+33.56
19.91%
jan 1, 1977
140.489
-61.587
-30.48%
jan 1, 1978
103.51
-36.98
-26.32%
jan 1, 1979
109.381
+5.872
5.67%
jan 1, 1980
88.454
-20.928
-19.13%
jan 1, 1981
69.996
-18.458
-20.87%
jan 1, 1982
47.29
-22.706
-32.44%
jan 1, 1983
44.562
-2.728
-5.77%
jan 1, 1984
40.715
-3.847
-8.63%
jan 1, 1985
41.386
+0.67
1.65%
jan 1, 1986
43.009
+1.624
3.92%
jan 1, 1987
50.637
+7.628
17.73%
jan 1, 1988
45.808
-4.829
-9.54%
jan 1, 1989
64.133
+18.325
40.0%
jan 1, 1990
63.119
-1.013
-1.58%
jan 1, 1991
66.981
+3.861
6.12%
jan 1, 1992
69.442
+2.461
3.67%
jan 1, 1993
86.037
+16.595
23.9%
jan 1, 1994
68.067
-17.97
-20.89%
jan 1, 1995
68.913
+0.845
1.24%
jan 1, 1996
80.869
+11.957
17.35%
jan 1, 1997
102.951
+22.081
27.3%
jan 1, 1998
96.615
-6.335
-6.15%
jan 1, 1999
100.313
+3.698
3.83%
jan 1, 2000
89.813
-10.5
-10.47%
jan 1, 2001
84.492
-5.321
-5.92%
jan 1, 2002
74.456
-10.036
-11.88%
jan 1, 2003
64.123
-10.333
-13.88%
jan 1, 2004
72.821
+8.698
13.56%
jan 1, 2005
88.244
+15.423
21.18%
jan 1, 2006
73.861
-14.383
-16.3%
jan 1, 2007
71.69
-2.171
-2.94%
jan 1, 2008
95.768
+24.078
33.59%
jan 1, 2009
67.583
-28.185
-29.43%
jan 1, 2010
92.652
+25.069
37.09%
jan 1, 2011
100.529
+7.877
8.5%
jan 1, 2012
94.278
-6.25
-6.22%
jan 1, 2013
99.086
+4.807
5.1%
jan 1, 2014
108.013
+8.927
9.01%
jan 1, 2015
101.394
-6.619
-6.13%
jan 1, 2016
107.705
+6.311
6.22%
Ranking of countries by current statistics by years


Comments: