29
/
en
AIzaSyAYiBZKx7MnpbEhh9jyipgxe19OcubqV5w
April 1, 2024
44720
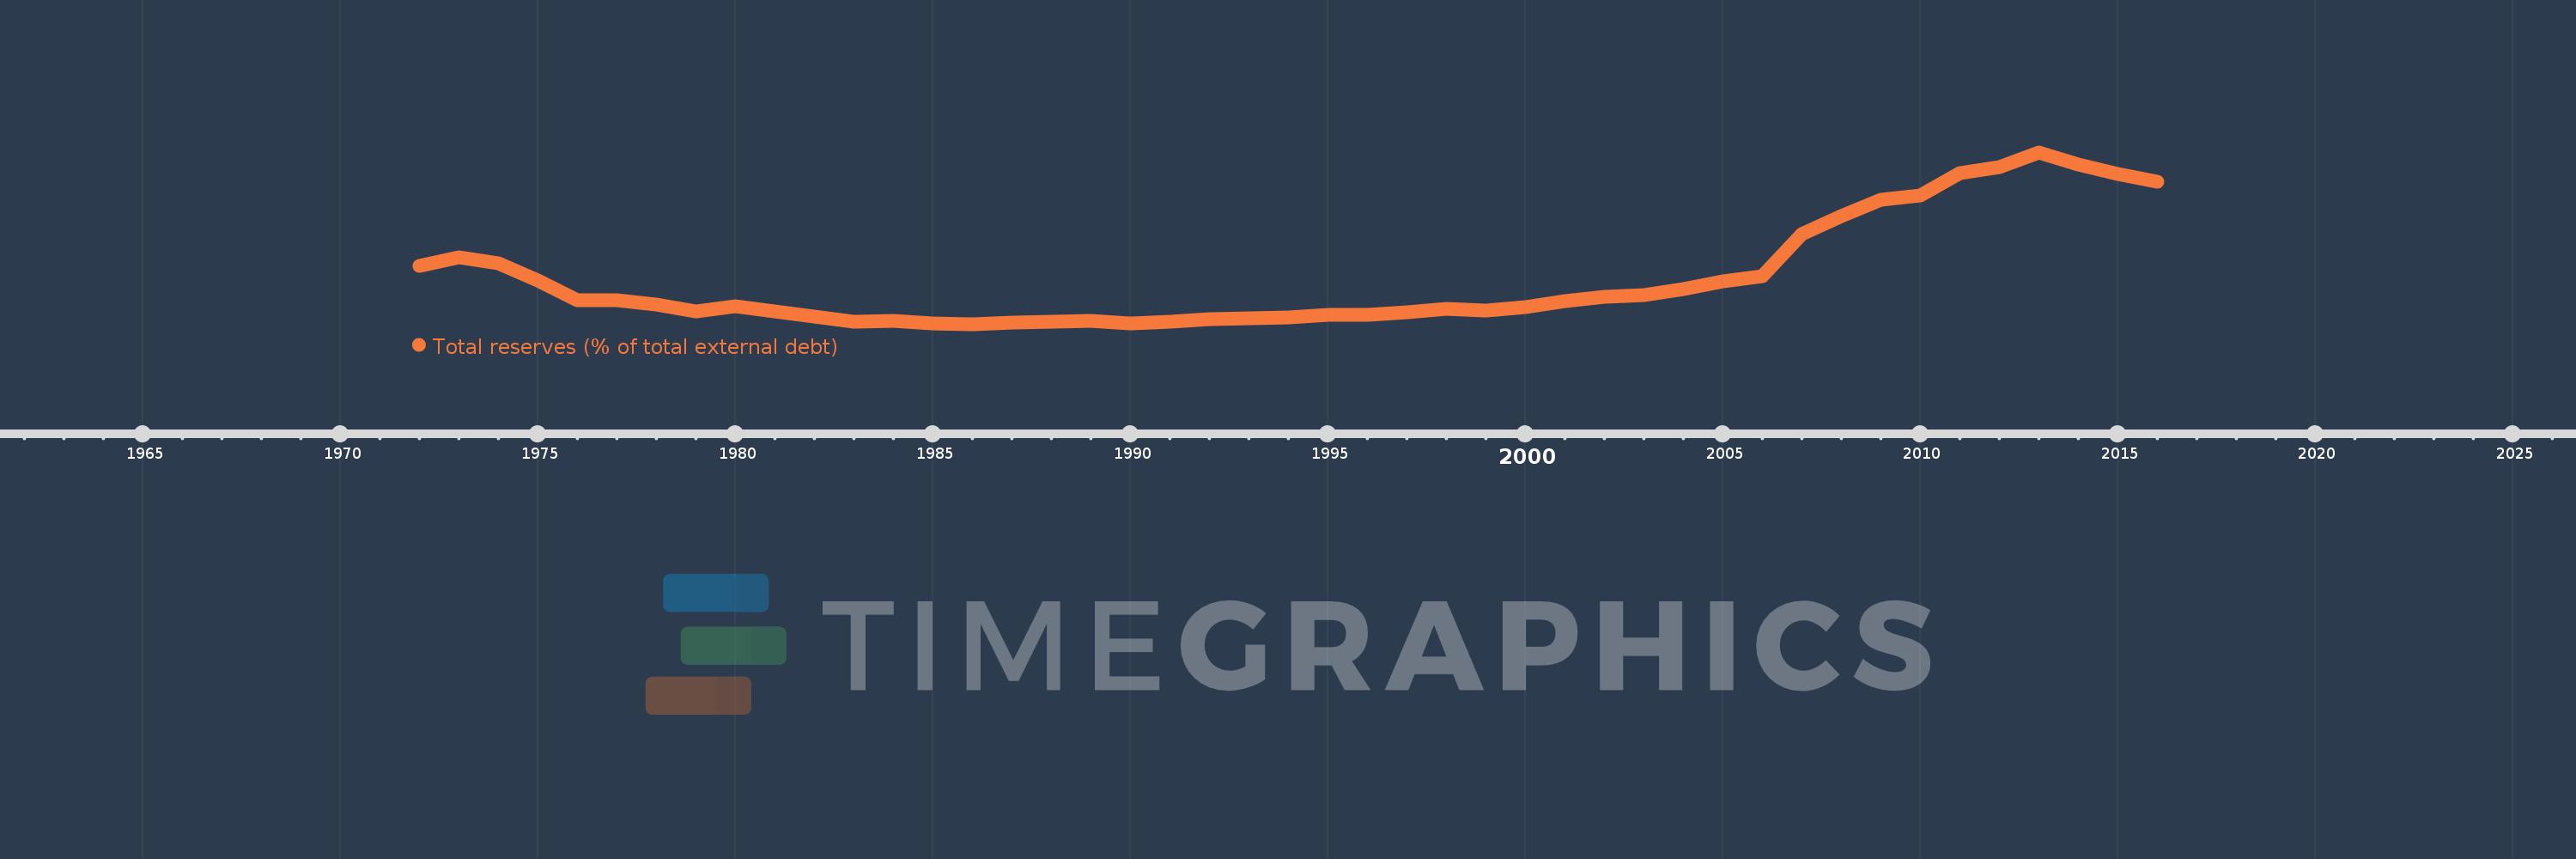
Least developed countries: UN classification
LDC
false
2
1
Total reserves (% of total external debt)
2016,2015,2014,2013,2012,2011,2010,2009,2008,2007,2006,2005,2004,2003,2002,2001,2000,1999,1998,1997,1996,1995,1994,1993,1992,1991,1990,1989,1988,1987,1986,1985,1984,1983,1982,1981,1980,1979,1978,1977,1976,1975,1974,1973,1972
This statistics in other country:
Timeline:
This timeline shows a graph from 1972 to 2016 of Least developed countries: UN classification. No data until 1971. Number of actual observations by date: 45.
Source name:
World Development Indicators
Source organization:
World Bank, International Debt Statistics.
Categories, topics:
Financial Sector, External Debt
Last updated:
apr 23, 2017
Indicators value changes by year
Maximum:
62.346
jan 1, 2013
At the date of observation
Value
Absolute change
Change from previous value
jan 1, 1972
23.924
+23.924
0.0%
jan 1, 1973
26.814
+2.89
12.08%
jan 1, 1974
24.737
-2.077
-7.74%
jan 1, 1975
18.929
-5.809
-23.48%
jan 1, 1976
12.092
-6.837
-36.12%
jan 1, 1977
12.295
+0.204
1.68%
jan 1, 1978
10.663
-1.633
-13.28%
jan 1, 1979
8.424
-2.238
-20.99%
jan 1, 1980
10.175
+1.751
20.78%
jan 1, 1981
8.459
-1.717
-16.87%
jan 1, 1982
6.727
-1.732
-20.47%
jan 1, 1983
5.028
-1.699
-25.26%
jan 1, 1984
5.275
+0.247
4.91%
jan 1, 1985
4.419
-0.856
-16.22%
jan 1, 1986
4.114
-0.305
-6.91%
jan 1, 1987
4.751
+0.637
15.48%
jan 1, 1988
5.054
+0.304
6.39%
jan 1, 1989
5.114
+0.06
1.18%
jan 1, 1990
4.503
-0.611
-11.94%
jan 1, 1991
4.863
+0.36
7.99%
jan 1, 1992
5.883
+1.02
20.98%
jan 1, 1993
6.258
+0.374
6.36%
jan 1, 1994
6.442
+0.185
2.95%
jan 1, 1995
7.351
+0.908
14.1%
jan 1, 1996
7.327
-0.023
-0.32%
jan 1, 1997
8.04
+0.713
9.73%
jan 1, 1998
9.327
+1.287
16.01%
jan 1, 1999
8.882
-0.445
-4.77%
jan 1, 2000
9.787
+0.906
10.2%
jan 1, 2001
12.025
+2.238
22.86%
jan 1, 2002
13.405
+1.38
11.48%
jan 1, 2003
13.894
+0.489
3.65%
jan 1, 2004
16.031
+2.136
15.37%
jan 1, 2005
18.638
+2.607
16.26%
jan 1, 2006
20.445
+1.807
9.7%
jan 1, 2007
34.687
+14.242
69.66%
jan 1, 2008
40.814
+6.127
17.66%
jan 1, 2009
46.177
+5.363
13.14%
jan 1, 2010
47.895
+1.718
3.72%
jan 1, 2011
55.333
+7.438
15.53%
jan 1, 2012
57.268
+1.935
3.5%
jan 1, 2013
62.346
+5.078
8.87%
jan 1, 2014
58.261
-4.086
-6.55%
jan 1, 2015
55.008
-3.253
-5.58%
jan 1, 2016
52.382
-2.626
-4.77%
Ranking of countries by current statistics by years


Comments: