29
/
en
AIzaSyAYiBZKx7MnpbEhh9jyipgxe19OcubqV5w
April 1, 2024
113081
Costa Rica
CRI
true
2
1
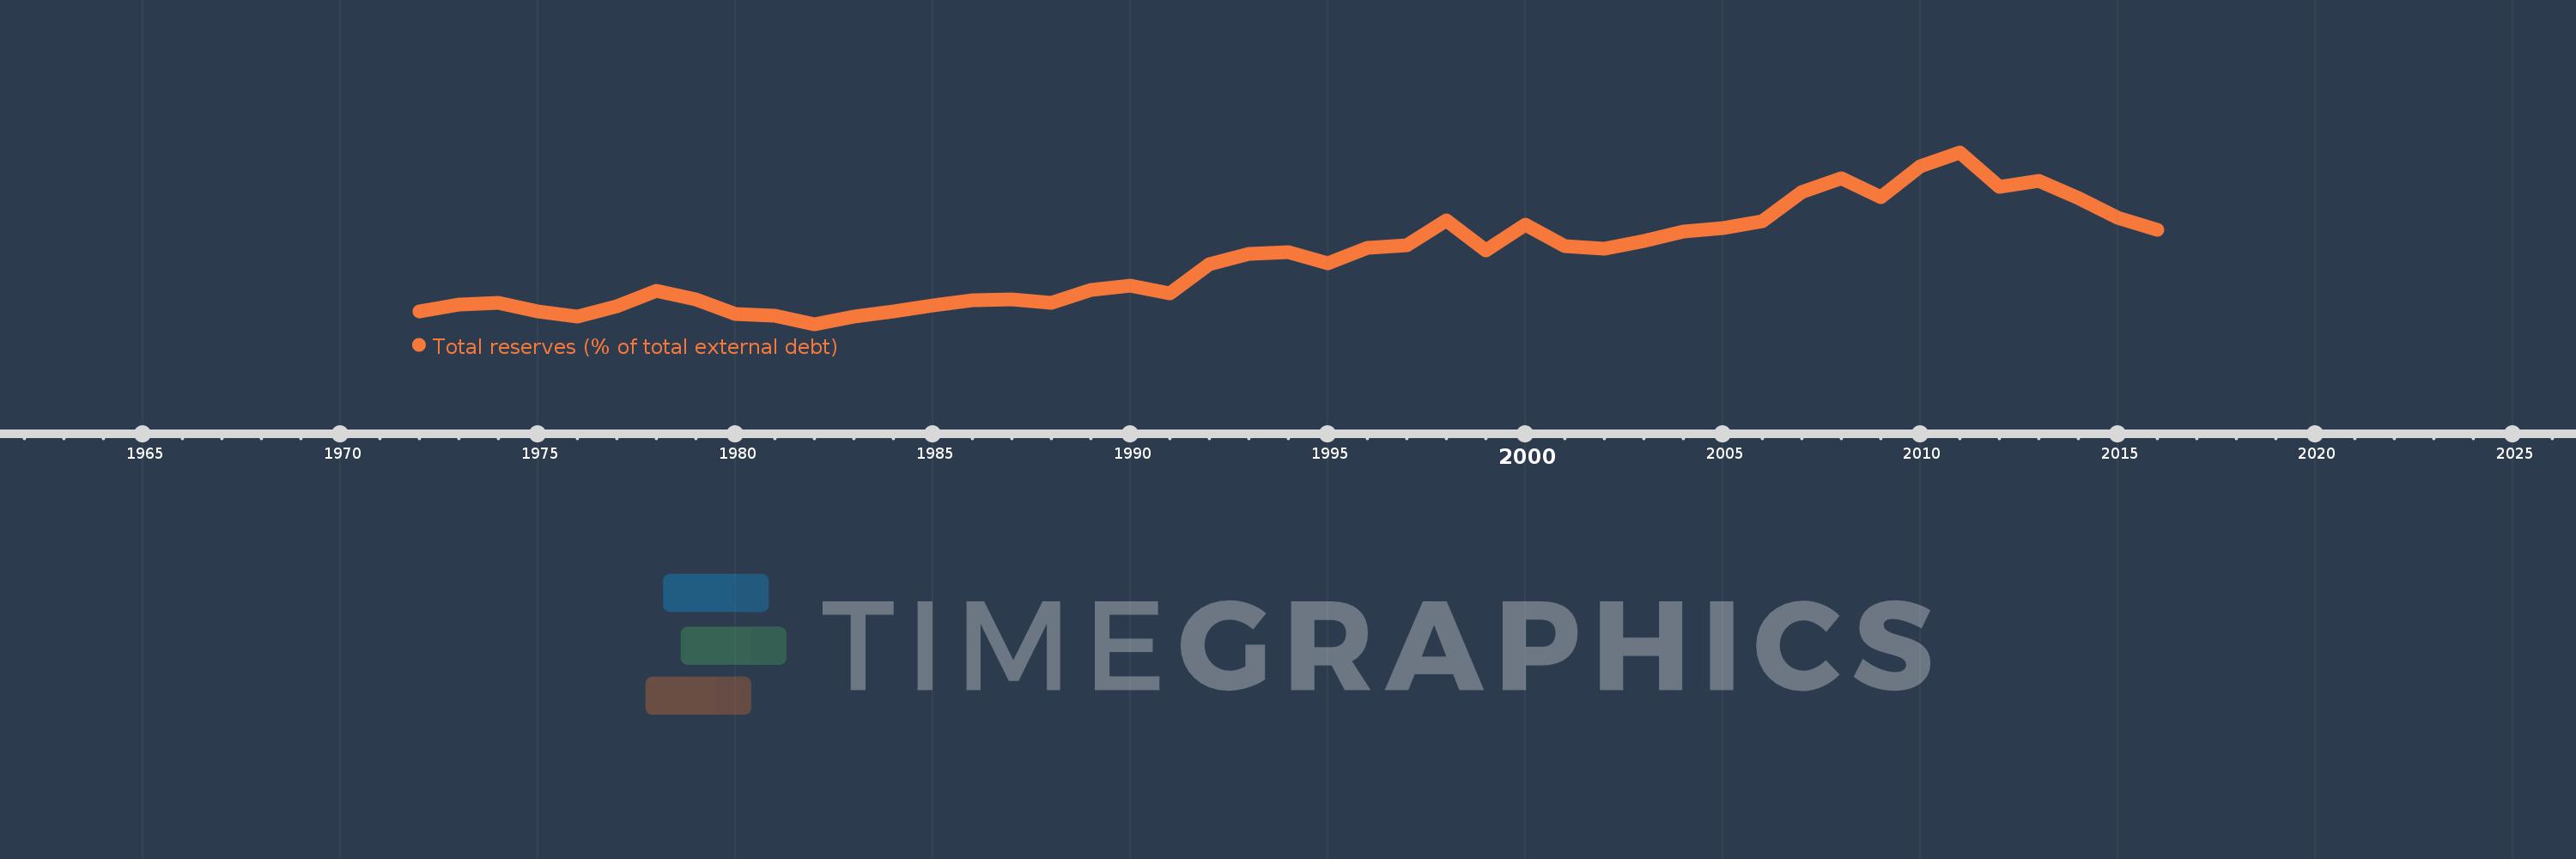
Total reserves (% of total external debt)
2016,2015,2014,2013,2012,2011,2010,2009,2008,2007,2006,2005,2004,2003,2002,2001,2000,1999,1998,1997,1996,1995,1994,1993,1992,1991,1990,1989,1988,1987,1986,1985,1984,1983,1982,1981,1980,1979,1978,1977,1976,1975,1974,1973,1972
This statistics in other country:
Timeline:
This timeline shows a graph from 1972 to 2016 of Costa Rica. No data until 1971. Number of actual observations by date: 45.
Source name:
World Development Indicators
Source organization:
World Bank, International Debt Statistics.
Categories, topics:
Financial Sector, External Debt
Last updated:
apr 23, 2017
Indicators value changes by year
Maximum:
56.745
jan 1, 2011
At the date of observation
Value
Absolute change
Change from previous value
jan 1, 1972
8.149
+8.149
0.0%
jan 1, 1973
10.169
+2.02
24.79%
jan 1, 1974
10.596
+0.427
4.2%
jan 1, 1975
8.14
-2.456
-23.18%
jan 1, 1976
6.54
-1.6
-19.66%
jan 1, 1977
9.619
+3.079
47.09%
jan 1, 1978
14.312
+4.693
48.79%
jan 1, 1979
11.877
-2.435
-17.01%
jan 1, 1980
7.305
-4.572
-38.49%
jan 1, 1981
6.874
-0.432
-5.91%
jan 1, 1982
4.169
-2.705
-39.35%
jan 1, 1983
6.631
+2.462
59.05%
jan 1, 1984
8.008
+1.377
20.76%
jan 1, 1985
10.024
+2.016
25.17%
jan 1, 1986
11.633
+1.609
16.05%
jan 1, 1987
11.738
+0.105
0.9%
jan 1, 1988
10.744
-0.994
-8.47%
jan 1, 1989
14.607
+3.863
35.95%
jan 1, 1990
15.915
+1.308
8.95%
jan 1, 1991
13.648
-2.267
-14.24%
jan 1, 1992
22.671
+9.023
66.11%
jan 1, 1993
25.704
+3.033
13.38%
jan 1, 1994
26.353
+0.65
2.53%
jan 1, 1995
22.816
-3.537
-13.42%
jan 1, 1996
27.471
+4.655
20.4%
jan 1, 1997
28.369
+0.898
3.27%
jan 1, 1998
36.011
+7.643
26.94%
jan 1, 1999
26.859
-9.152
-25.42%
jan 1, 2000
34.66
+7.801
29.04%
jan 1, 2001
28.094
-6.566
-18.94%
jan 1, 2002
27.225
-0.869
-3.09%
jan 1, 2003
29.628
+2.403
8.83%
jan 1, 2004
32.561
+2.934
9.9%
jan 1, 2005
33.667
+1.106
3.4%
jan 1, 2006
35.675
+2.008
5.96%
jan 1, 2007
44.57
+8.895
24.93%
jan 1, 2008
48.929
+4.359
9.78%
jan 1, 2009
42.998
-5.93
-12.12%
jan 1, 2010
52.398
+9.4
21.86%
jan 1, 2011
56.745
+4.347
8.3%
jan 1, 2012
46.301
-10.444
-18.4%
jan 1, 2013
47.914
+1.613
3.48%
jan 1, 2014
42.784
-5.13
-10.71%
jan 1, 2015
36.719
-6.066
-14.18%
jan 1, 2016
33.1
-3.619
-9.86%
Ranking of countries by current statistics by years


Comments: