29
/
en
AIzaSyAYiBZKx7MnpbEhh9jyipgxe19OcubqV5w
April 1, 2024
286691
Zambia
ZMB
true
2
1
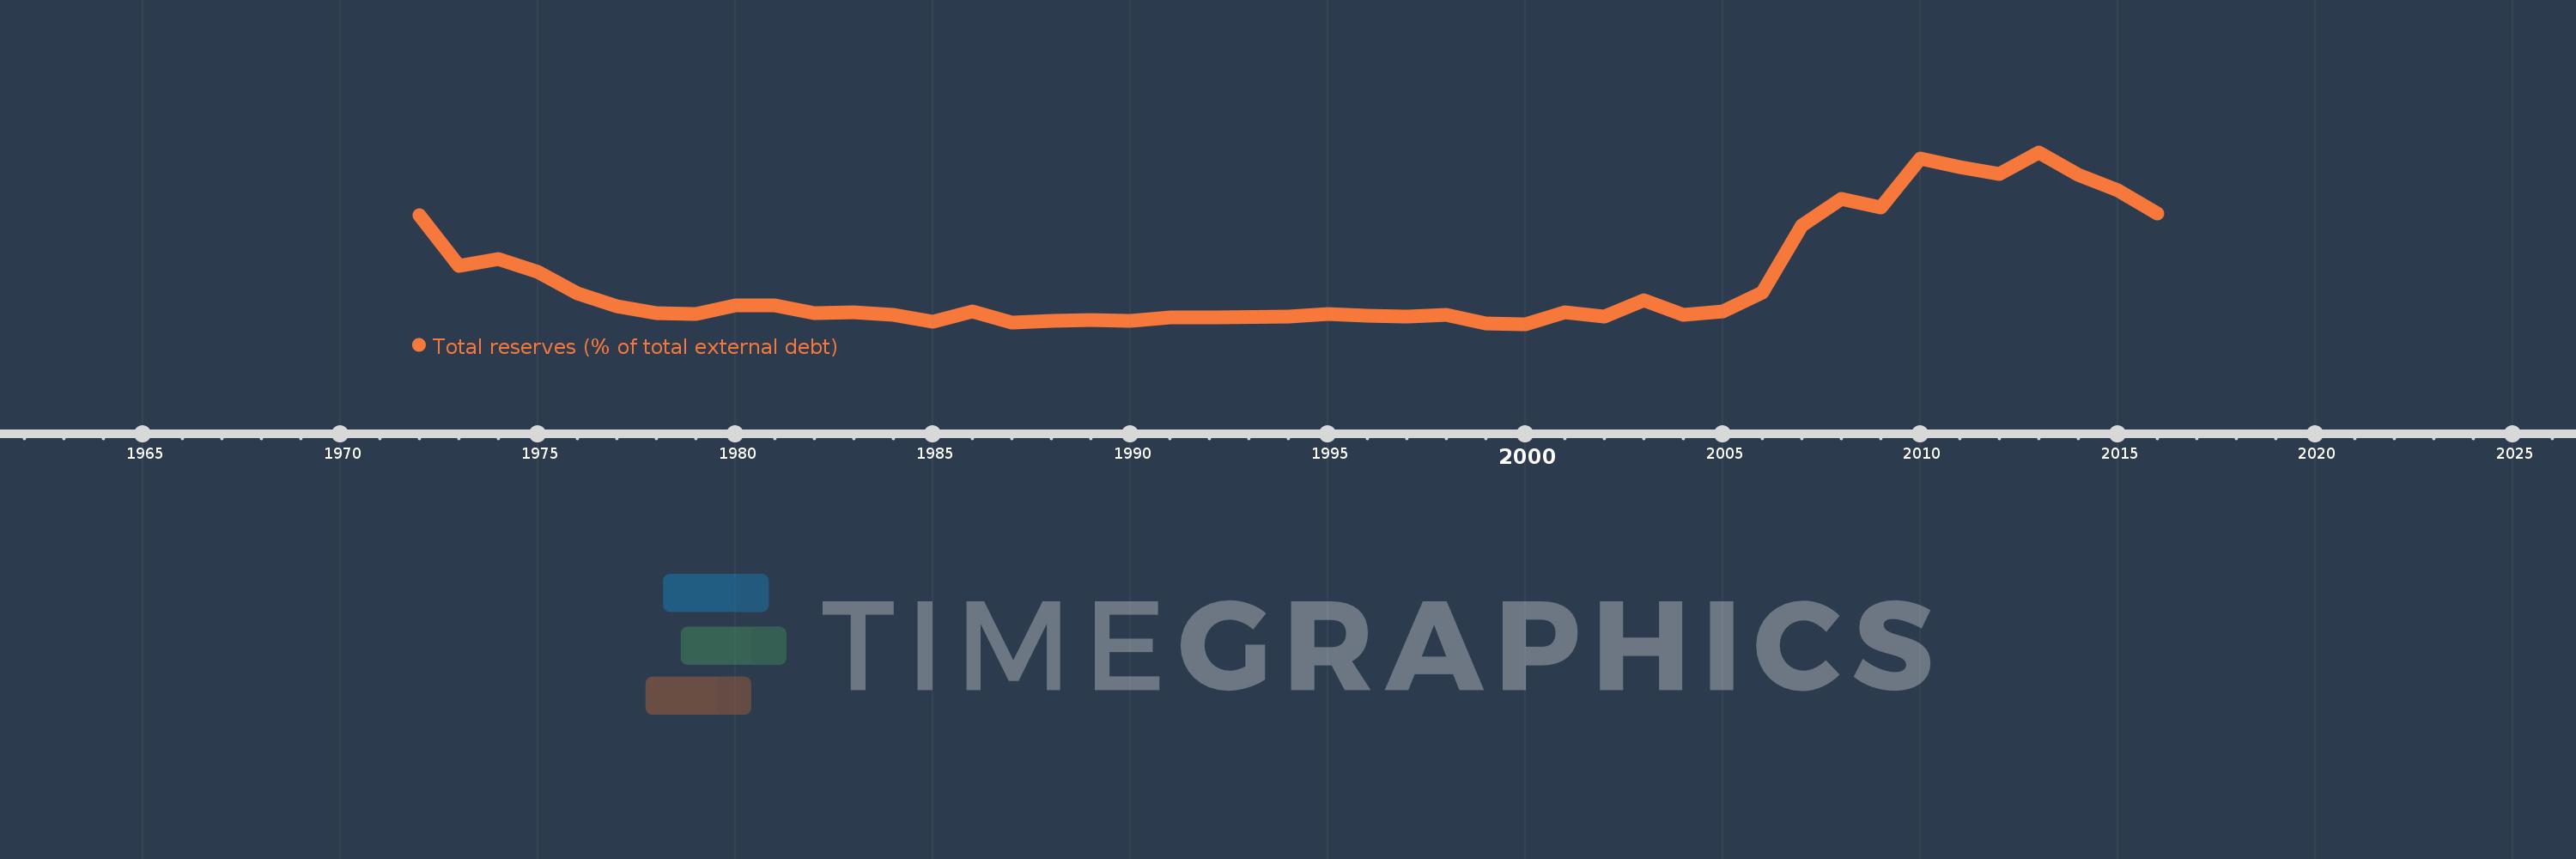
Total reserves (% of total external debt)
2016,2015,2014,2013,2012,2011,2010,2009,2008,2007,2006,2005,2004,2003,2002,2001,2000,1999,1998,1997,1996,1995,1994,1992,1991,1990,1989,1988,1987,1986,1985,1984,1983,1982,1981,1980,1979,1978,1977,1976,1975,1974,1973,1972
This statistics in other country:
Timeline:
This timeline shows a graph from 1972 to 2016 of Zambia. No data until 1971. Number of actual observations by date: 44.
Source name:
World Development Indicators
Source organization:
World Bank, International Debt Statistics.
Categories, topics:
Financial Sector, External Debt
Last updated:
apr 23, 2017
Indicators value changes by year
Maximum:
52.013
jan 1, 2013
At the date of observation
Value
Absolute change
Change from previous value
jan 1, 1972
33.334
+33.334
0.0%
jan 1, 1973
18.164
-15.17
-45.51%
jan 1, 1974
20.179
+2.015
11.1%
jan 1, 1975
16.358
-3.821
-18.94%
jan 1, 1976
9.847
-6.511
-39.8%
jan 1, 1977
6.089
-3.758
-38.16%
jan 1, 1978
4.025
-2.064
-33.9%
jan 1, 1979
3.744
-0.281
-6.98%
jan 1, 1980
6.285
+2.541
67.88%
jan 1, 1981
6.337
+0.052
0.83%
jan 1, 1982
3.945
-2.392
-37.74%
jan 1, 1983
4.296
+0.351
8.89%
jan 1, 1984
3.666
-0.63
-14.66%
jan 1, 1985
1.461
-2.205
-60.13%
jan 1, 1986
4.481
+3.02
206.64%
jan 1, 1987
1.269
-3.212
-71.68%
jan 1, 1988
1.709
+0.44
34.67%
jan 1, 1989
2.082
+0.373
21.8%
jan 1, 1990
1.878
-0.204
-9.81%
jan 1, 1991
2.914
+1.037
55.21%
jan 1, 1992
2.765
-0.149
-5.11%
jan 1, 1994
2.969
+0.204
7.37%
jan 1, 1995
3.938
+0.969
32.64%
jan 1, 1996
3.201
-0.737
-18.72%
jan 1, 1997
3.154
-0.046
-1.45%
jan 1, 1998
3.59
+0.435
13.8%
jan 1, 1999
1.01
-2.58
-71.87%
jan 1, 2000
0.763
-0.247
-24.43%
jan 1, 2001
4.213
+3.45
452.04%
jan 1, 2002
2.964
-1.249
-29.65%
jan 1, 2003
8.017
+5.054
170.52%
jan 1, 2004
3.604
-4.414
-55.05%
jan 1, 2005
4.471
+0.867
24.06%
jan 1, 2006
10.251
+5.78
129.29%
jan 1, 2007
30.296
+20.045
195.54%
jan 1, 2008
38.148
+7.852
25.92%
jan 1, 2009
35.576
-2.573
-6.74%
jan 1, 2010
50.13
+14.554
40.91%
jan 1, 2011
47.757
-2.373
-4.73%
jan 1, 2012
45.577
-2.18
-4.56%
jan 1, 2013
52.013
+6.436
14.12%
jan 1, 2014
45.284
-6.728
-12.94%
jan 1, 2015
40.828
-4.456
-9.84%
jan 1, 2016
33.78
-7.048
-17.26%
Ranking of countries by current statistics by years


Comments: