29
/
en
AIzaSyAYiBZKx7MnpbEhh9jyipgxe19OcubqV5w
April 1, 2024
127011
El Salvador
SLV
true
2
1
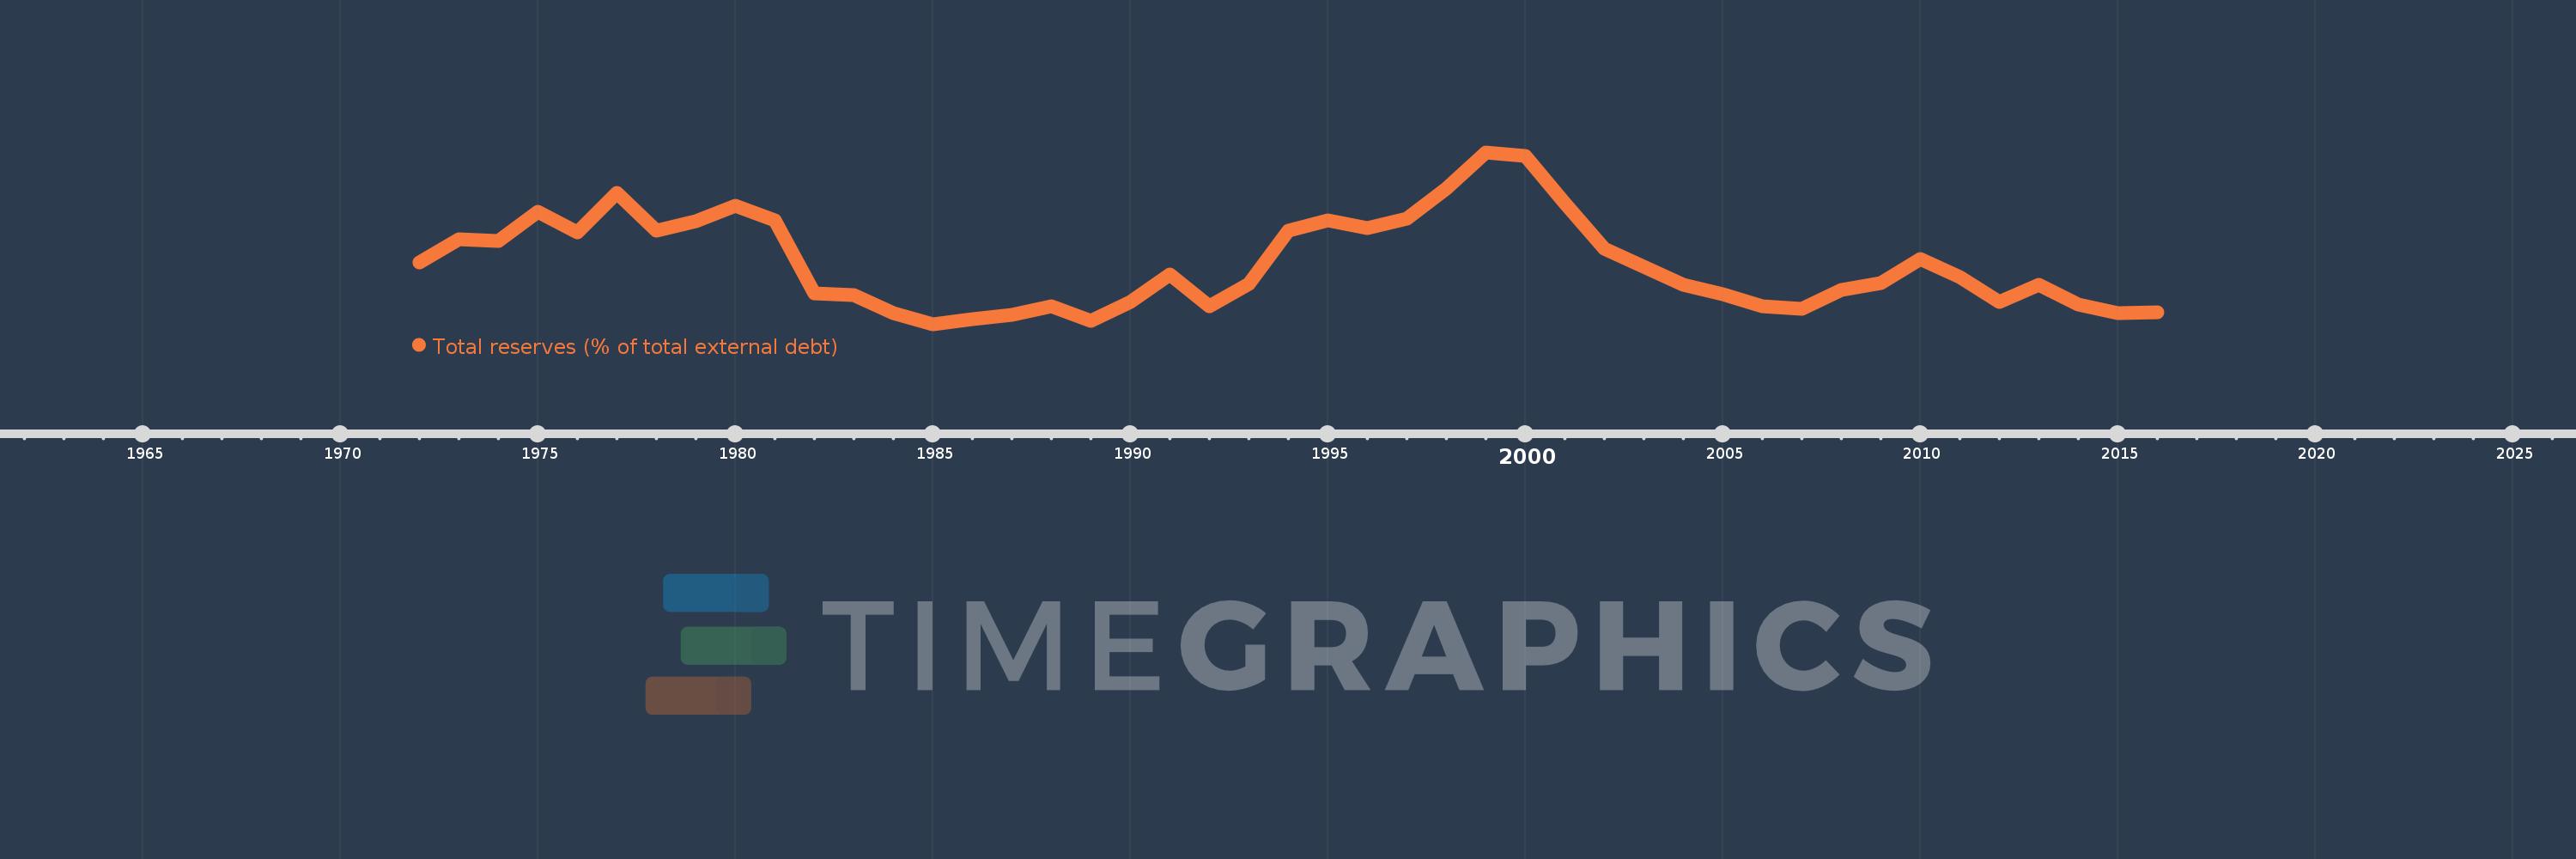
Total reserves (% of total external debt)
2016,2015,2014,2013,2012,2011,2010,2009,2008,2007,2006,2005,2004,2003,2002,2001,2000,1999,1998,1997,1996,1995,1994,1993,1992,1991,1990,1989,1988,1987,1986,1985,1984,1983,1982,1981,1980,1979,1978,1977,1976,1975,1974,1973,1972
This statistics in other country:
Timeline:
This timeline shows a graph from 1972 to 2016 of El Salvador. No data until 1971. Number of actual observations by date: 45.
Source name:
World Development Indicators
Source organization:
World Bank, International Debt Statistics.
Categories, topics:
Financial Sector, External Debt
Last updated:
apr 23, 2017
Indicators value changes by year
Minimum:
16.105
jan 1, 1985
Maximum:
52.803
jan 1, 1999
At the date of observation
Value
Absolute change
Change from previous value
jan 1, 1972
29.342
+29.342
0.0%
jan 1, 1973
34.329
+4.987
17.0%
jan 1, 1974
33.867
-0.462
-1.35%
jan 1, 1975
40.095
+6.229
18.39%
jan 1, 1976
35.638
-4.458
-11.12%
jan 1, 1977
44.186
+8.549
23.99%
jan 1, 1978
36.114
-8.072
-18.27%
jan 1, 1979
38.193
+2.079
5.76%
jan 1, 1980
41.357
+3.164
8.28%
jan 1, 1981
38.292
-3.065
-7.41%
jan 1, 1982
22.704
-15.588
-40.71%
jan 1, 1983
22.41
-0.295
-1.3%
jan 1, 1984
18.424
-3.986
-17.79%
jan 1, 1985
16.105
-2.32
-12.59%
jan 1, 1986
17.103
+0.998
6.2%
jan 1, 1987
18.059
+0.956
5.59%
jan 1, 1988
19.929
+1.869
10.35%
jan 1, 1989
16.872
-3.057
-15.34%
jan 1, 1990
20.909
+4.037
23.93%
jan 1, 1991
26.677
+5.769
27.59%
jan 1, 1992
19.938
-6.739
-25.26%
jan 1, 1993
24.65
+4.712
23.63%
jan 1, 1994
36.103
+11.453
46.46%
jan 1, 1995
38.321
+2.218
6.14%
jan 1, 1996
36.576
-1.745
-4.55%
jan 1, 1997
38.648
+2.072
5.67%
jan 1, 1998
45.081
+6.432
16.64%
jan 1, 1999
52.803
+7.722
17.13%
jan 1, 2000
51.98
-0.823
-1.56%
jan 1, 2001
41.925
-10.054
-19.34%
jan 1, 2002
32.247
-9.678
-23.09%
jan 1, 2003
28.323
-3.924
-12.17%
jan 1, 2004
24.52
-3.802
-13.42%
jan 1, 2005
22.582
-1.939
-7.91%
jan 1, 2006
19.876
-2.706
-11.98%
jan 1, 2007
19.371
-0.505
-2.54%
jan 1, 2008
23.369
+3.998
20.64%
jan 1, 2009
24.828
+1.46
6.25%
jan 1, 2010
30.101
+5.272
21.23%
jan 1, 2011
26.183
-3.917
-13.01%
jan 1, 2012
20.911
-5.273
-20.14%
jan 1, 2013
24.494
+3.583
17.14%
jan 1, 2014
20.363
-4.131
-16.87%
jan 1, 2015
18.533
-1.83
-8.99%
jan 1, 2016
18.6
+0.067
0.36%
Ranking of countries by current statistics by years


Comments: