29
/
en
AIzaSyAYiBZKx7MnpbEhh9jyipgxe19OcubqV5w
April 1, 2024
198375
Moldova
MDA
true
2
1
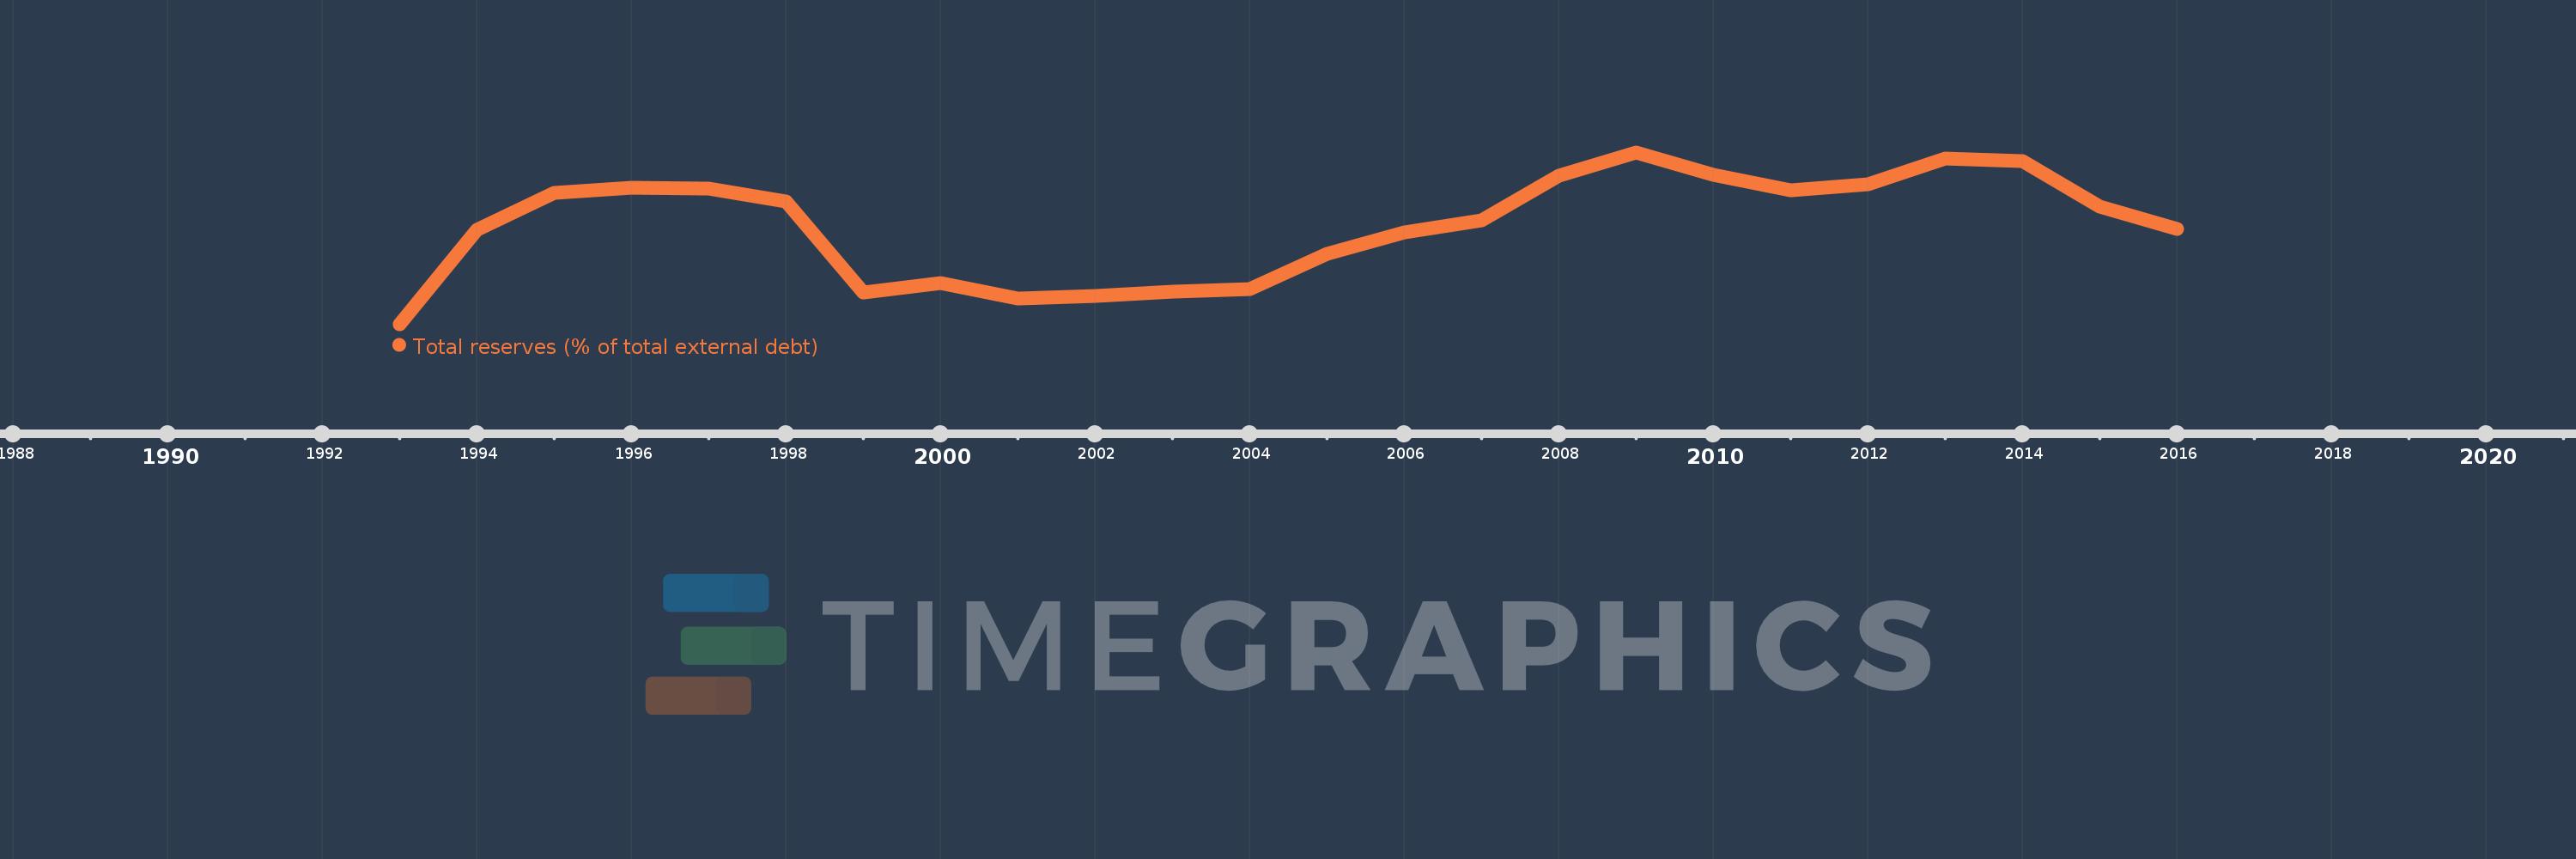
Total reserves (% of total external debt)
2016,2015,2014,2013,2012,2011,2010,2009,2008,2007,2006,2005,2004,2003,2002,2001,2000,1999,1998,1997,1996,1995,1994,1993
This statistics in other country:
Timeline:
This timeline shows a graph from 1993 to 2016 of Moldova. No data until 1992. Number of actual observations by date: 24.
Source name:
World Development Indicators
Source organization:
World Bank, International Debt Statistics.
Categories, topics:
Financial Sector, External Debt
Last updated:
apr 23, 2017
Indicators value changes by year
Maximum:
44.903
jan 1, 2009
At the date of observation
Value
Absolute change
Change from previous value
jan 1, 1993
6.368
+6.368
0.0%
jan 1, 1994
27.494
+21.125
331.73%
jan 1, 1995
35.806
+8.312
30.23%
jan 1, 1996
36.971
+1.166
3.26%
jan 1, 1997
36.802
-0.169
-0.46%
jan 1, 1998
33.812
-2.99
-8.13%
jan 1, 1999
13.405
-20.407
-60.35%
jan 1, 2000
15.65
+2.244
16.74%
jan 1, 2001
12.08
-3.569
-22.81%
jan 1, 2002
12.763
+0.683
5.65%
jan 1, 2003
13.684
+0.92
7.21%
jan 1, 2004
14.281
+0.598
4.37%
jan 1, 2005
22.244
+7.963
55.76%
jan 1, 2006
26.921
+4.676
21.02%
jan 1, 2007
29.575
+2.654
9.86%
jan 1, 2008
39.631
+10.056
34.0%
jan 1, 2009
44.903
+5.273
13.3%
jan 1, 2010
39.844
-5.059
-11.27%
jan 1, 2011
36.355
-3.489
-8.76%
jan 1, 2012
37.672
+1.317
3.62%
jan 1, 2013
43.489
+5.817
15.44%
jan 1, 2014
42.999
-0.49
-1.13%
jan 1, 2015
32.833
-10.167
-23.64%
jan 1, 2016
27.716
-5.116
-15.58%
Ranking of countries by current statistics by years


Comments: