29
/
en
AIzaSyAYiBZKx7MnpbEhh9jyipgxe19OcubqV5w
April 1, 2024
128941
Eritrea
ERI
true
2
1
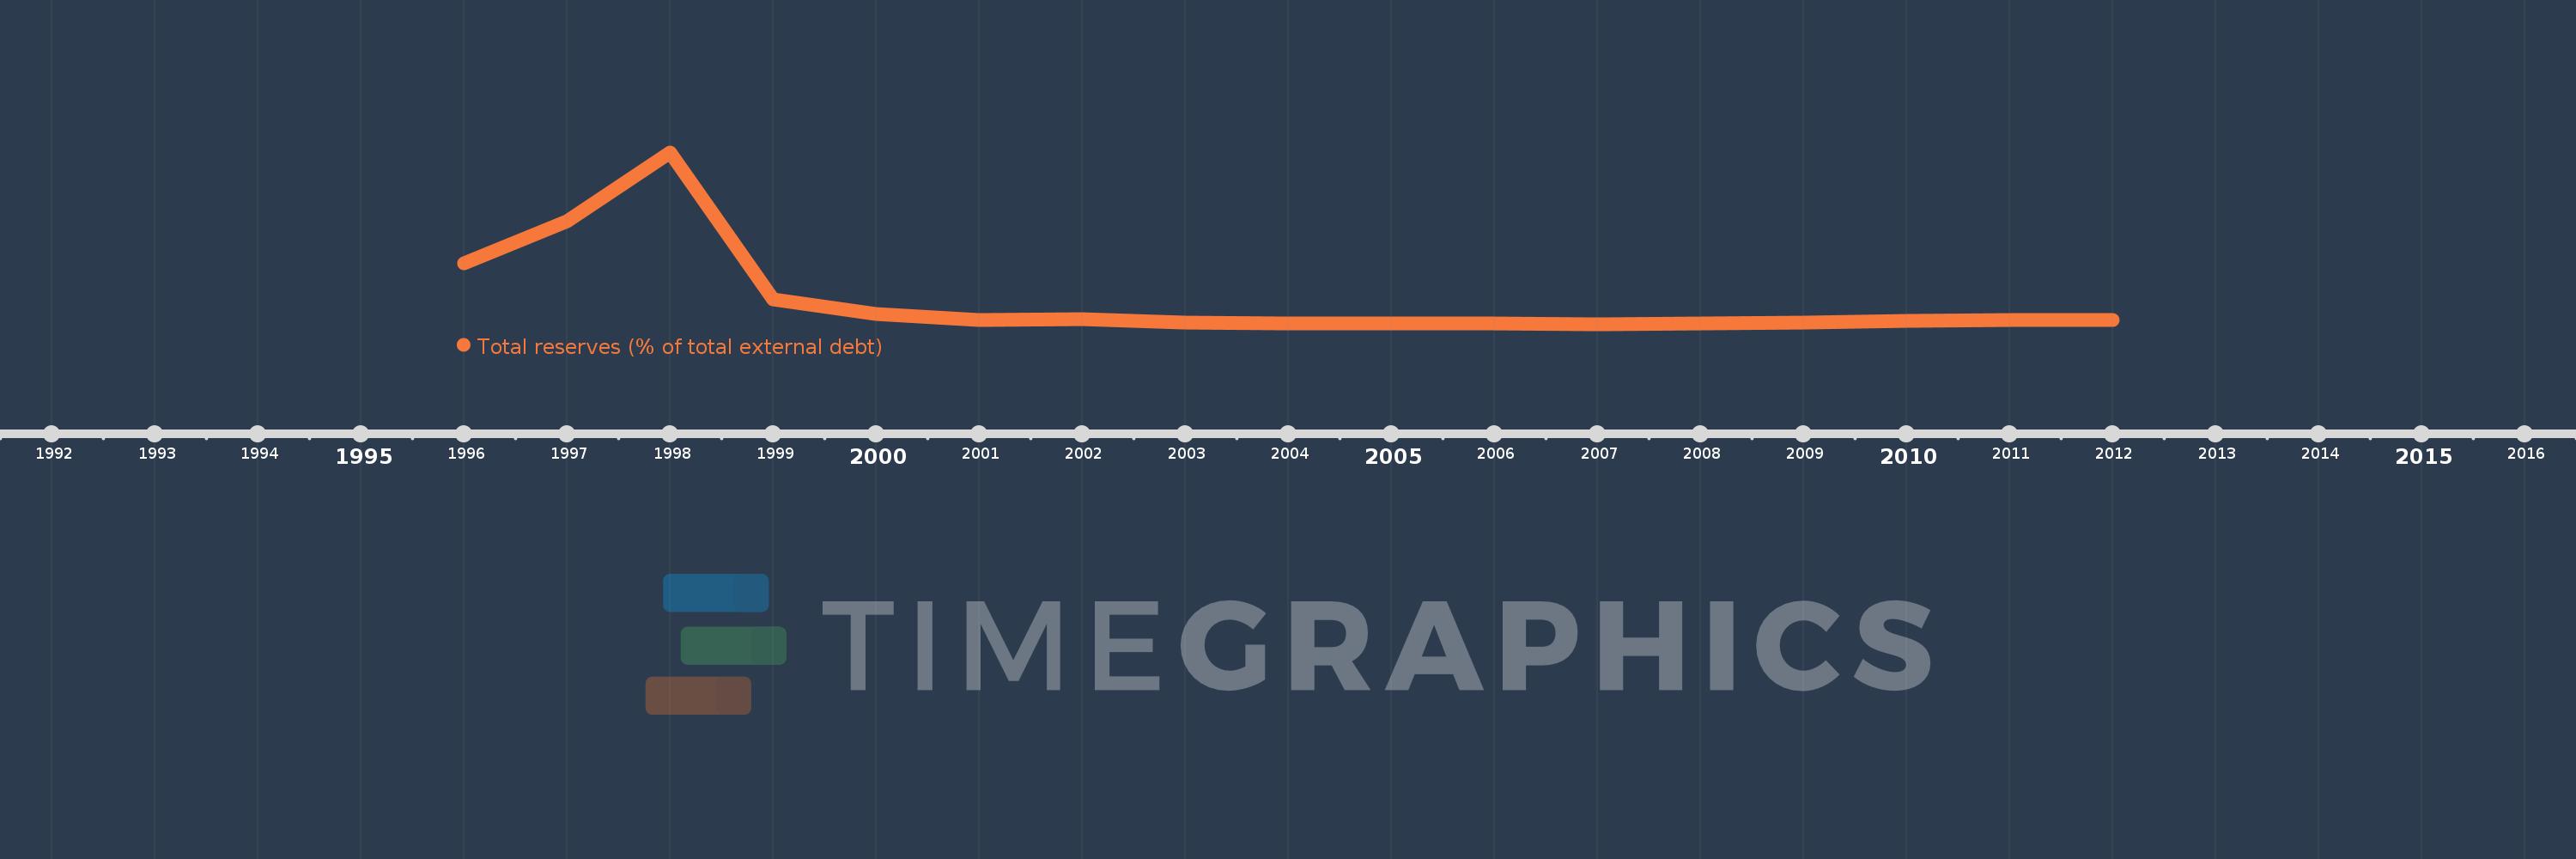
Total reserves (% of total external debt)
2012,2011,2010,2009,2008,2007,2006,2005,2004,2003,2002,2001,2000,1999,1998,1997,1996
This statistics in other country:
Timeline:
This timeline shows a graph from 1996 to 2012 of Eritrea. No data until 1995. Number of actual observations by date: 17.
Source name:
World Development Indicators
Source organization:
World Bank, International Debt Statistics.
Categories, topics:
Financial Sector, External Debt
Last updated:
apr 23, 2017
Indicators value changes by year
Maximum:
304.256
jan 1, 1998
At the date of observation
Value
Absolute change
Change from previous value
jan 1, 1996
110.361
+110.361
0.0%
jan 1, 1997
183.619
+73.258
66.38%
jan 1, 1998
304.256
+120.636
65.7%
jan 1, 1999
46.638
-257.617
-84.67%
jan 1, 2000
21.534
-25.104
-53.83%
jan 1, 2001
10.959
-10.575
-49.11%
jan 1, 2002
11.657
+0.698
6.37%
jan 1, 2003
5.6
-6.057
-51.96%
jan 1, 2004
3.766
-1.834
-32.75%
jan 1, 2005
4.57
+0.805
21.37%
jan 1, 2006
3.69
-0.88
-19.26%
jan 1, 2007
3.082
-0.609
-16.49%
jan 1, 2008
3.823
+0.742
24.06%
jan 1, 2009
5.803
+1.979
51.77%
jan 1, 2010
8.567
+2.764
47.64%
jan 1, 2011
10.96
+2.392
27.93%
jan 1, 2012
10.879
-0.081
-0.74%
Ranking of countries by current statistics by years


Comments: