29
/
en
AIzaSyAYiBZKx7MnpbEhh9jyipgxe19OcubqV5w
April 1, 2024
234258
Sao Tome and Principe
STP
true
2
1
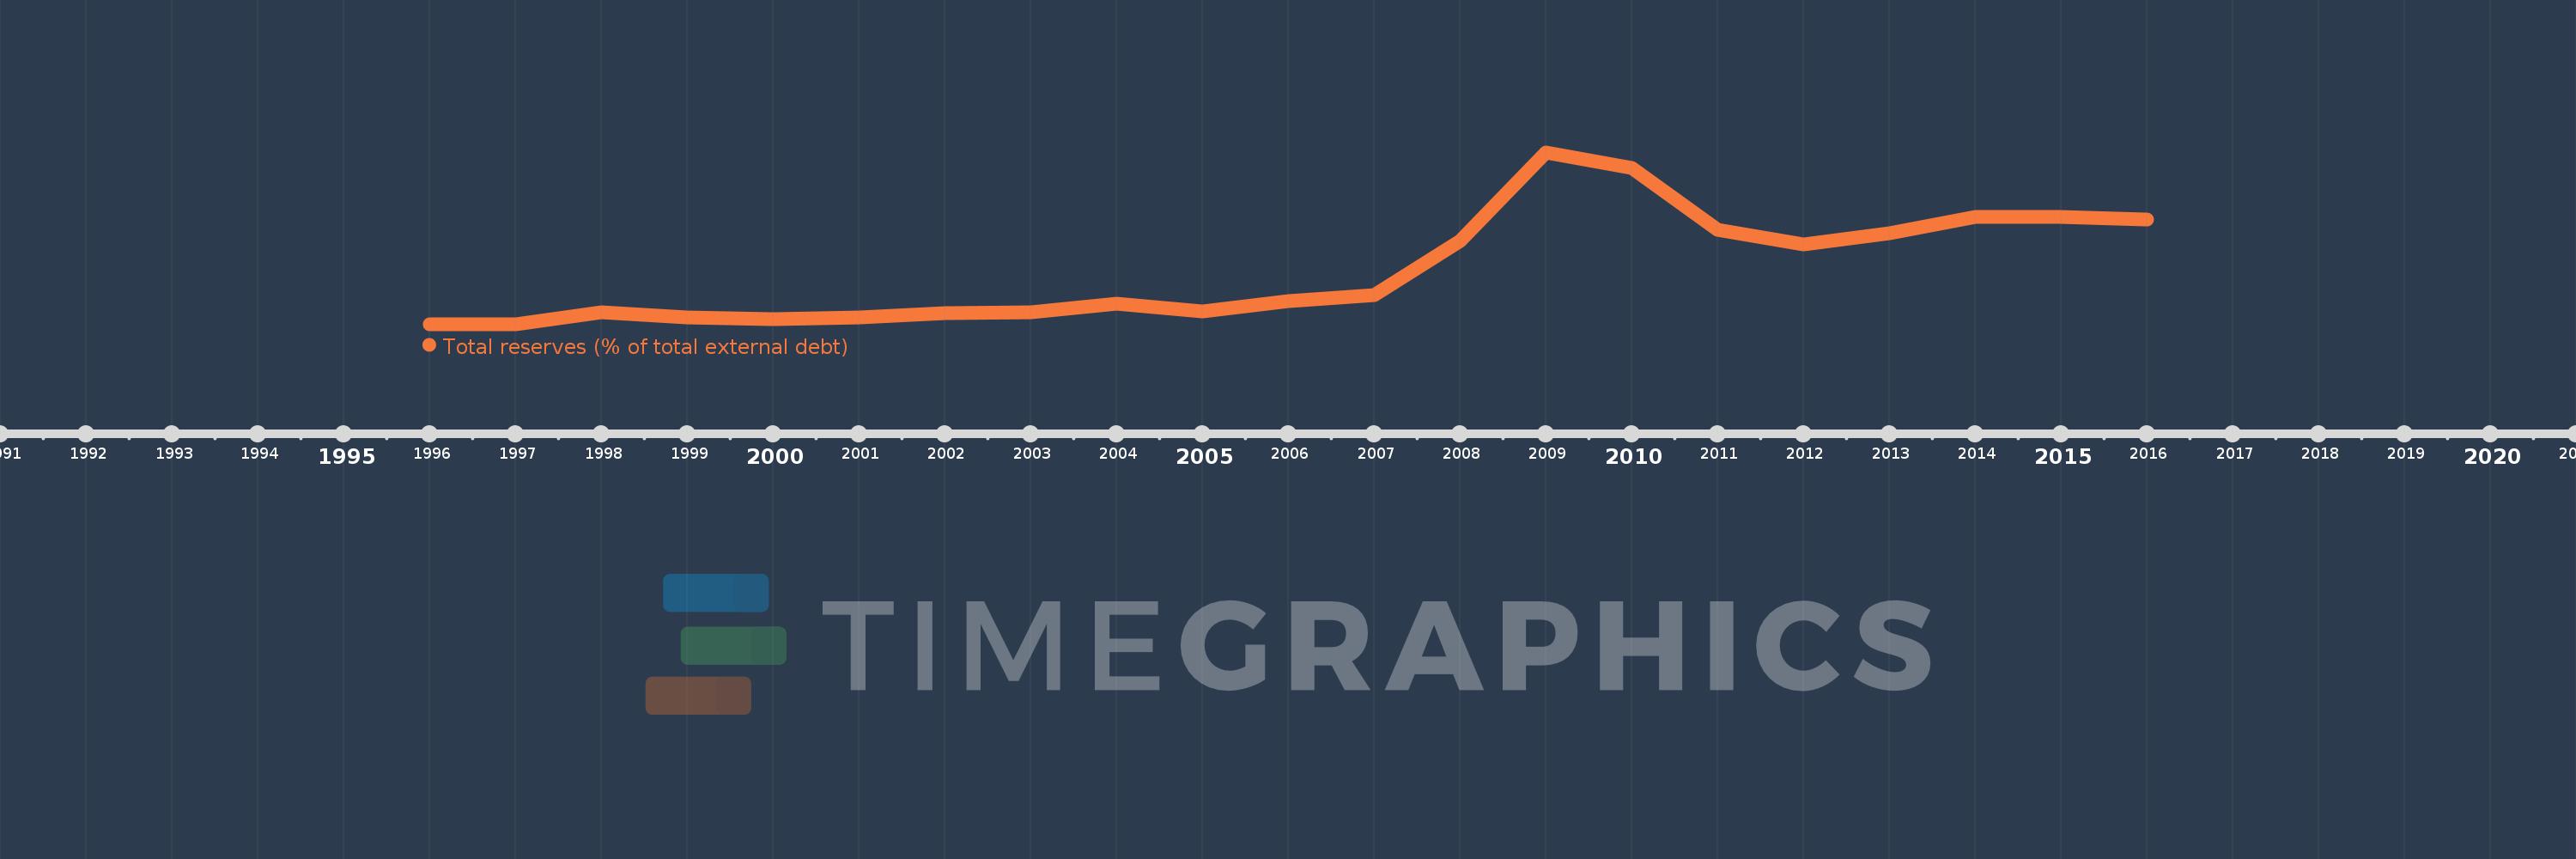
Total reserves (% of total external debt)
2016,2015,2014,2013,2012,2011,2010,2009,2008,2007,2006,2005,2004,2003,2002,2001,2000,1999,1998,1997,1996
This statistics in other country:
Timeline:
This timeline shows a graph from 1996 to 2016 of Sao Tome and Principe. No data until 1995. Number of actual observations by date: 21.
Source name:
World Development Indicators
Source organization:
World Bank, International Debt Statistics.
Categories, topics:
Financial Sector, External Debt
Last updated:
apr 23, 2017
Indicators value changes by year
At the date of observation
Value
Absolute change
Change from previous value
jan 1, 1996
2.091
+2.091
0.0%
jan 1, 1997
2.137
+0.046
2.19%
jan 1, 1998
5.217
+3.08
144.1%
jan 1, 1999
3.749
-1.468
-28.14%
jan 1, 2000
3.38
-0.369
-9.83%
jan 1, 2001
3.818
+0.438
12.96%
jan 1, 2002
5.021
+1.202
31.49%
jan 1, 2003
5.204
+0.183
3.65%
jan 1, 2004
7.492
+2.288
43.97%
jan 1, 2005
5.402
-2.09
-27.9%
jan 1, 2006
7.957
+2.555
47.3%
jan 1, 2007
9.723
+1.766
22.2%
jan 1, 2008
23.667
+13.944
143.42%
jan 1, 2009
46.53
+22.863
96.6%
jan 1, 2010
42.457
-4.073
-8.75%
jan 1, 2011
26.6
-15.857
-37.35%
jan 1, 2012
22.646
-3.954
-14.87%
jan 1, 2013
25.607
+2.961
13.08%
jan 1, 2014
29.772
+4.165
16.26%
jan 1, 2015
29.785
+0.013
0.04%
jan 1, 2016
29.117
-0.668
-2.24%
Ranking of countries by current statistics by years


Comments: