29
/
en
AIzaSyAYiBZKx7MnpbEhh9jyipgxe19OcubqV5w
April 1, 2024
165644
Jordan
JOR
true
2
1
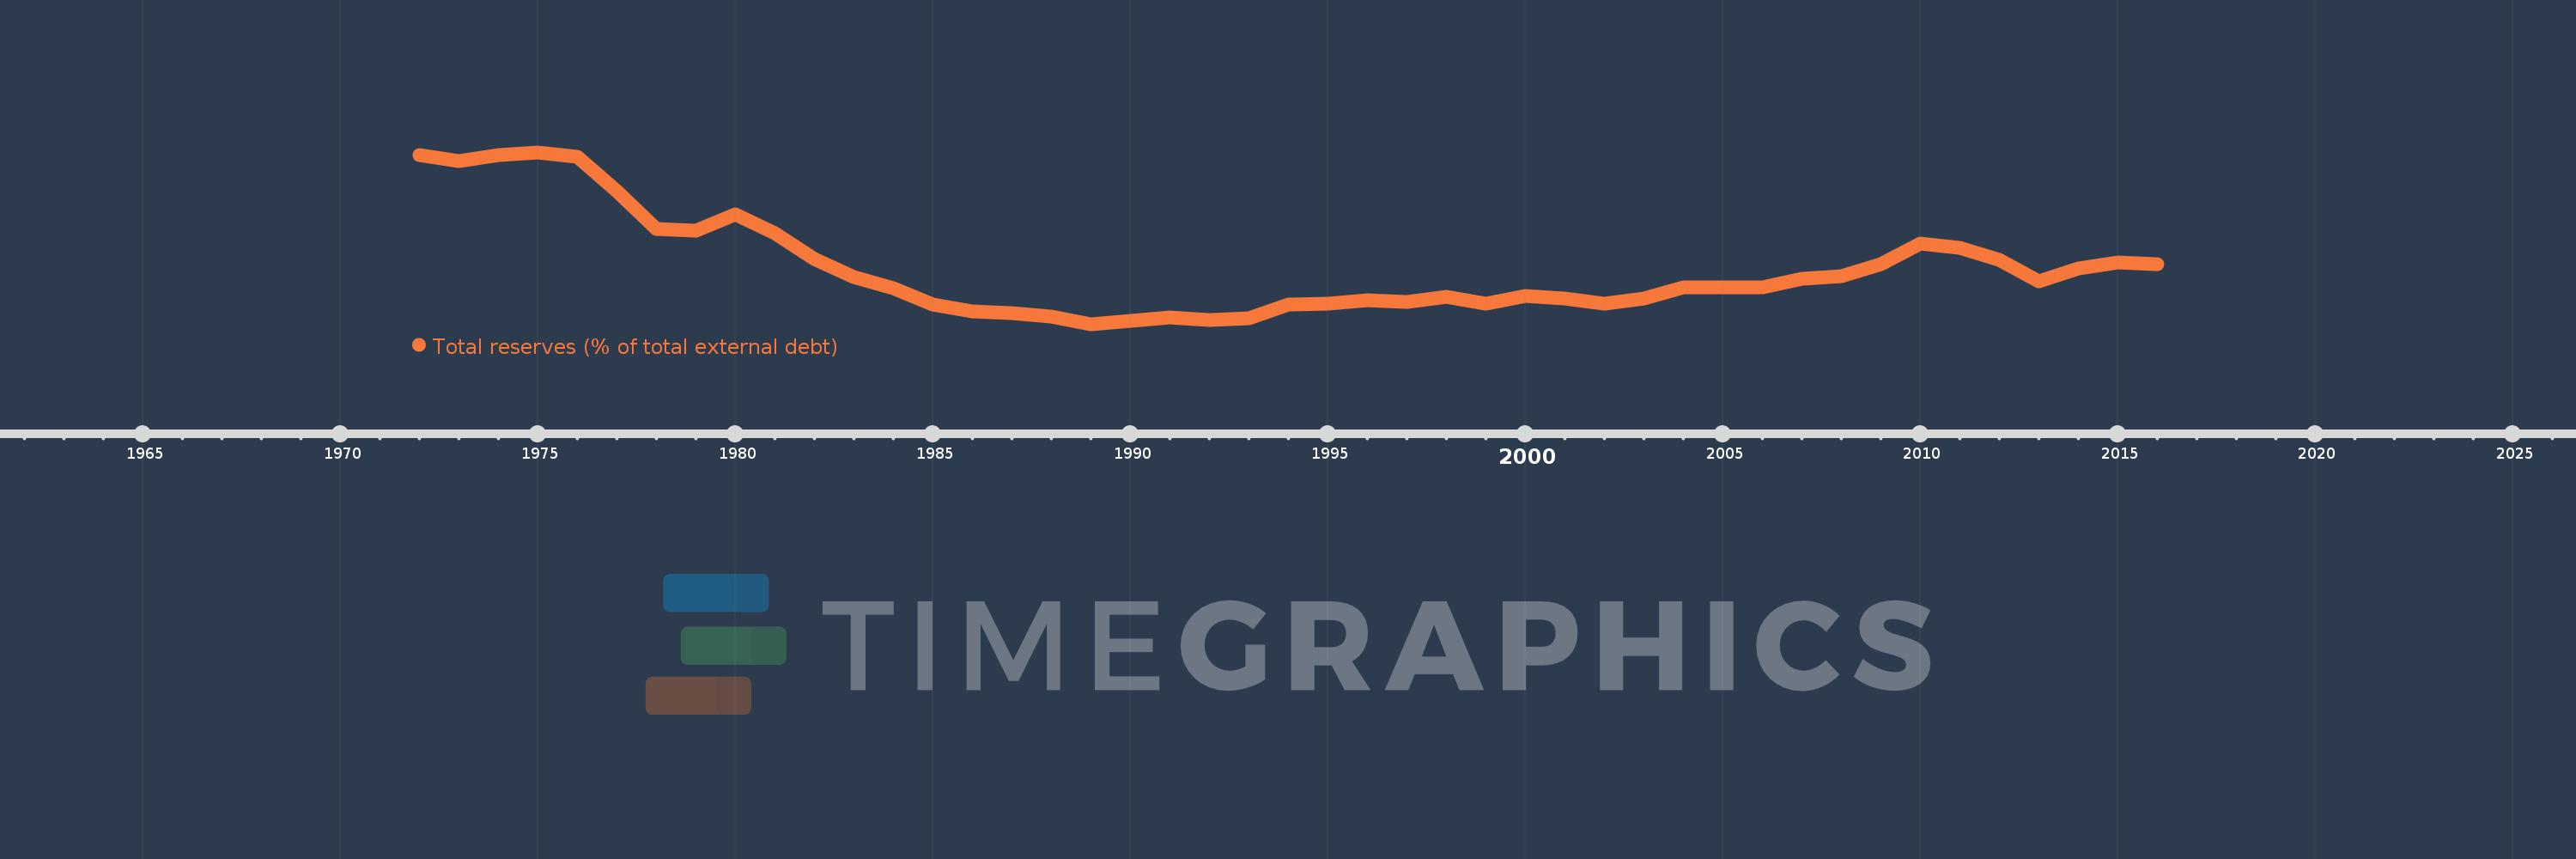
Total reserves (% of total external debt)
2016,2015,2014,2013,2012,2011,2010,2009,2008,2007,2006,2005,2004,2003,2002,2001,2000,1999,1998,1997,1996,1995,1994,1993,1992,1991,1990,1989,1988,1987,1986,1985,1984,1983,1982,1981,1980,1979,1978,1977,1976,1975,1974,1973,1972
This statistics in other country:
Timeline:
This timeline shows a graph from 1972 to 2016 of Jordan. No data until 1971. Number of actual observations by date: 45.
Source name:
World Development Indicators
Source organization:
World Bank, International Debt Statistics.
Categories, topics:
Financial Sector, External Debt
Last updated:
apr 23, 2017
Indicators value changes by year
Maximum:
170.467
jan 1, 1975
At the date of observation
Value
Absolute change
Change from previous value
jan 1, 1972
168.039
+168.039
0.0%
jan 1, 1973
162.179
-5.86
-3.49%
jan 1, 1974
167.687
+5.508
3.4%
jan 1, 1975
170.467
+2.78
1.66%
jan 1, 1976
166.467
-4.0
-2.35%
jan 1, 1977
133.852
-32.615
-19.59%
jan 1, 1978
97.459
-36.393
-27.19%
jan 1, 1979
96.179
-1.28
-1.31%
jan 1, 1980
111.704
+15.525
16.14%
jan 1, 1981
93.456
-18.248
-16.34%
jan 1, 1982
69.102
-24.354
-26.06%
jan 1, 1983
52.012
-17.09
-24.73%
jan 1, 1984
41.041
-10.971
-21.09%
jan 1, 1985
25.655
-15.385
-37.49%
jan 1, 1986
19.517
-6.138
-23.93%
jan 1, 1987
17.656
-1.862
-9.54%
jan 1, 1988
14.529
-3.127
-17.71%
jan 1, 1989
7.002
-7.527
-51.81%
jan 1, 1990
10.533
+3.532
50.44%
jan 1, 1991
13.666
+3.132
29.74%
jan 1, 1992
11.389
-2.277
-16.66%
jan 1, 1993
12.93
+1.541
13.53%
jan 1, 1994
25.508
+12.578
97.28%
jan 1, 1995
26.439
+0.931
3.65%
jan 1, 1996
29.756
+3.317
12.55%
jan 1, 1997
27.842
-1.914
-6.43%
jan 1, 1998
33.306
+5.464
19.62%
jan 1, 1999
26.296
-7.01
-21.05%
jan 1, 2000
34.172
+7.875
29.95%
jan 1, 2001
31.107
-3.064
-8.97%
jan 1, 2002
26.706
-4.401
-14.15%
jan 1, 2003
31.626
+4.92
18.42%
jan 1, 2004
42.416
+10.79
34.12%
jan 1, 2005
41.745
-0.671
-1.58%
jan 1, 2006
42.322
+0.577
1.38%
jan 1, 2007
49.937
+7.615
17.99%
jan 1, 2008
52.864
+2.927
5.86%
jan 1, 2009
63.844
+10.98
20.77%
jan 1, 2010
84.114
+20.27
31.75%
jan 1, 2011
79.849
-4.265
-5.07%
jan 1, 2012
68.454
-11.395
-14.27%
jan 1, 2013
47.773
-20.681
-30.21%
jan 1, 2014
59.663
+11.89
24.89%
jan 1, 2015
66.088
+6.425
10.77%
jan 1, 2016
64.367
-1.721
-2.6%
Ranking of countries by current statistics by years


Comments: