29
/
en
AIzaSyAYiBZKx7MnpbEhh9jyipgxe19OcubqV5w
April 1, 2024
132750
Fiji
FJI
true
2
1
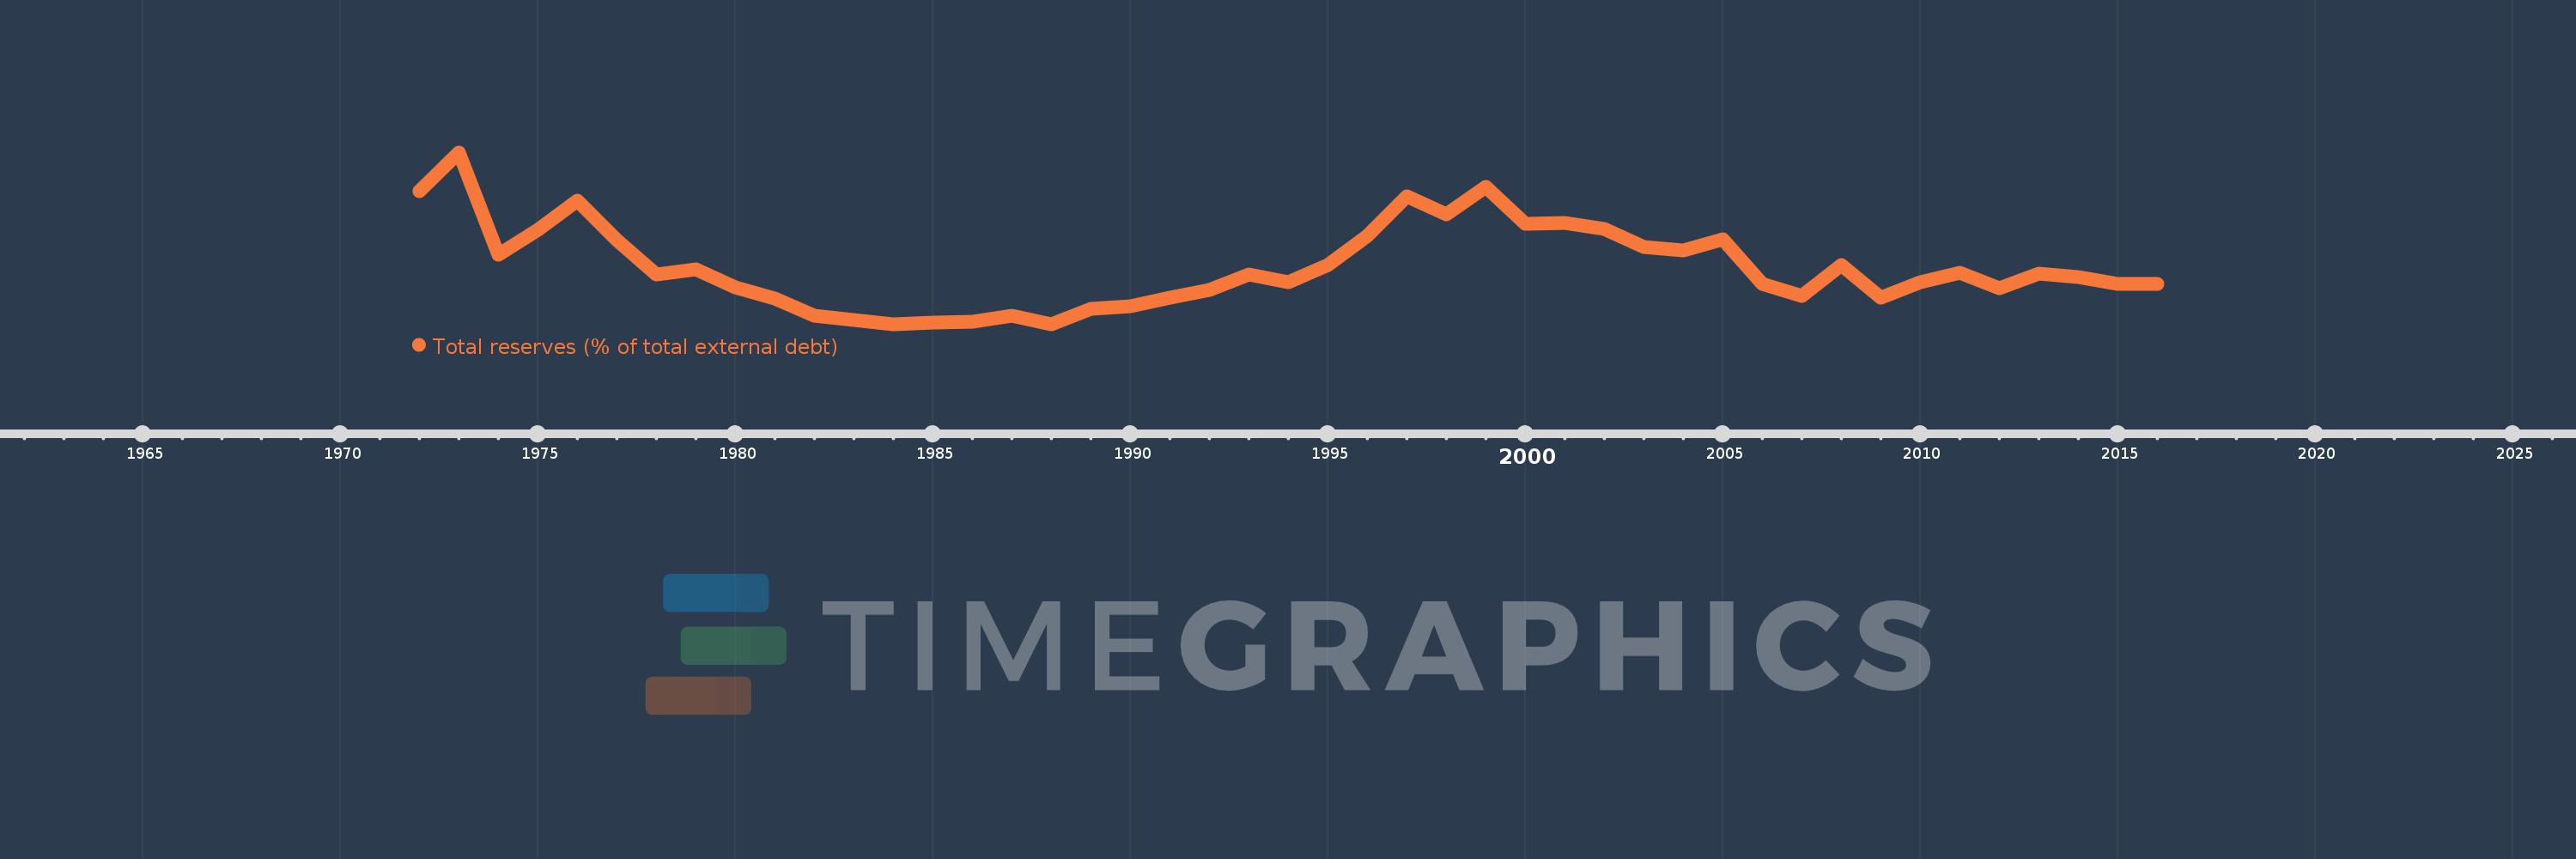
Total reserves (% of total external debt)
2016,2015,2014,2013,2012,2011,2010,2009,2008,2007,2006,2005,2004,2003,2002,2001,2000,1999,1998,1997,1996,1995,1994,1993,1992,1991,1990,1989,1988,1987,1986,1985,1984,1983,1982,1981,1980,1979,1978,1977,1976,1975,1974,1973,1972
This statistics in other country:
Timeline:
This timeline shows a graph from 1972 to 2016 of Fiji. No data until 1971. Number of actual observations by date: 45.
Source name:
World Development Indicators
Source organization:
World Bank, International Debt Statistics.
Categories, topics:
Financial Sector, External Debt
Last updated:
apr 23, 2017
Indicators value changes by year
Minimum:
36.117
jan 1, 1984
Maximum:
334.984
jan 1, 1973
At the date of observation
Value
Absolute change
Change from previous value
jan 1, 1972
267.466
+267.466
0.0%
jan 1, 1973
334.984
+67.518
25.24%
jan 1, 1974
156.676
-178.308
-53.23%
jan 1, 1975
200.241
+43.565
27.81%
jan 1, 1976
250.572
+50.331
25.14%
jan 1, 1977
182.045
-68.527
-27.35%
jan 1, 1978
122.768
-59.277
-32.56%
jan 1, 1979
132.342
+9.575
7.8%
jan 1, 1980
100.347
-31.996
-24.18%
jan 1, 1981
80.46
-19.887
-19.82%
jan 1, 1982
50.461
-29.998
-37.28%
jan 1, 1983
43.649
-6.812
-13.5%
jan 1, 1984
36.117
-7.533
-17.26%
jan 1, 1985
38.417
+2.3
6.37%
jan 1, 1986
40.058
+1.641
4.27%
jan 1, 1987
51.644
+11.586
28.92%
jan 1, 1988
36.349
-15.295
-29.62%
jan 1, 1989
63.005
+26.656
73.33%
jan 1, 1990
66.976
+3.971
6.3%
jan 1, 1991
82.101
+15.125
22.58%
jan 1, 1992
96.318
+14.217
17.32%
jan 1, 1993
123.195
+26.877
27.9%
jan 1, 1994
109.551
-13.644
-11.07%
jan 1, 1995
138.904
+29.352
26.79%
jan 1, 1996
190.465
+51.562
37.12%
jan 1, 1997
257.909
+67.444
35.41%
jan 1, 1998
227.985
-29.924
-11.6%
jan 1, 1999
274.932
+46.948
20.59%
jan 1, 2000
210.41
-64.522
-23.47%
jan 1, 2001
211.802
+1.391
0.66%
jan 1, 2002
201.987
-9.815
-4.63%
jan 1, 2003
169.809
-32.178
-15.93%
jan 1, 2004
164.106
-5.703
-3.36%
jan 1, 2005
183.163
+19.057
11.61%
jan 1, 2006
106.157
-77.006
-42.04%
jan 1, 2007
85.68
-20.477
-19.29%
jan 1, 2008
139.282
+53.602
62.56%
jan 1, 2009
82.908
-56.374
-40.47%
jan 1, 2010
109.21
+26.302
31.72%
jan 1, 2011
126.366
+17.156
15.71%
jan 1, 2012
98.358
-28.007
-22.16%
jan 1, 2013
123.732
+25.374
25.8%
jan 1, 2014
118.603
-5.13
-4.15%
jan 1, 2015
105.767
-12.836
-10.82%
jan 1, 2016
105.472
-0.295
-0.28%
Ranking of countries by current statistics by years


Comments: