29
/
en
AIzaSyAYiBZKx7MnpbEhh9jyipgxe19OcubqV5w
April 1, 2024
195028
Mauritius
MUS
true
2
1
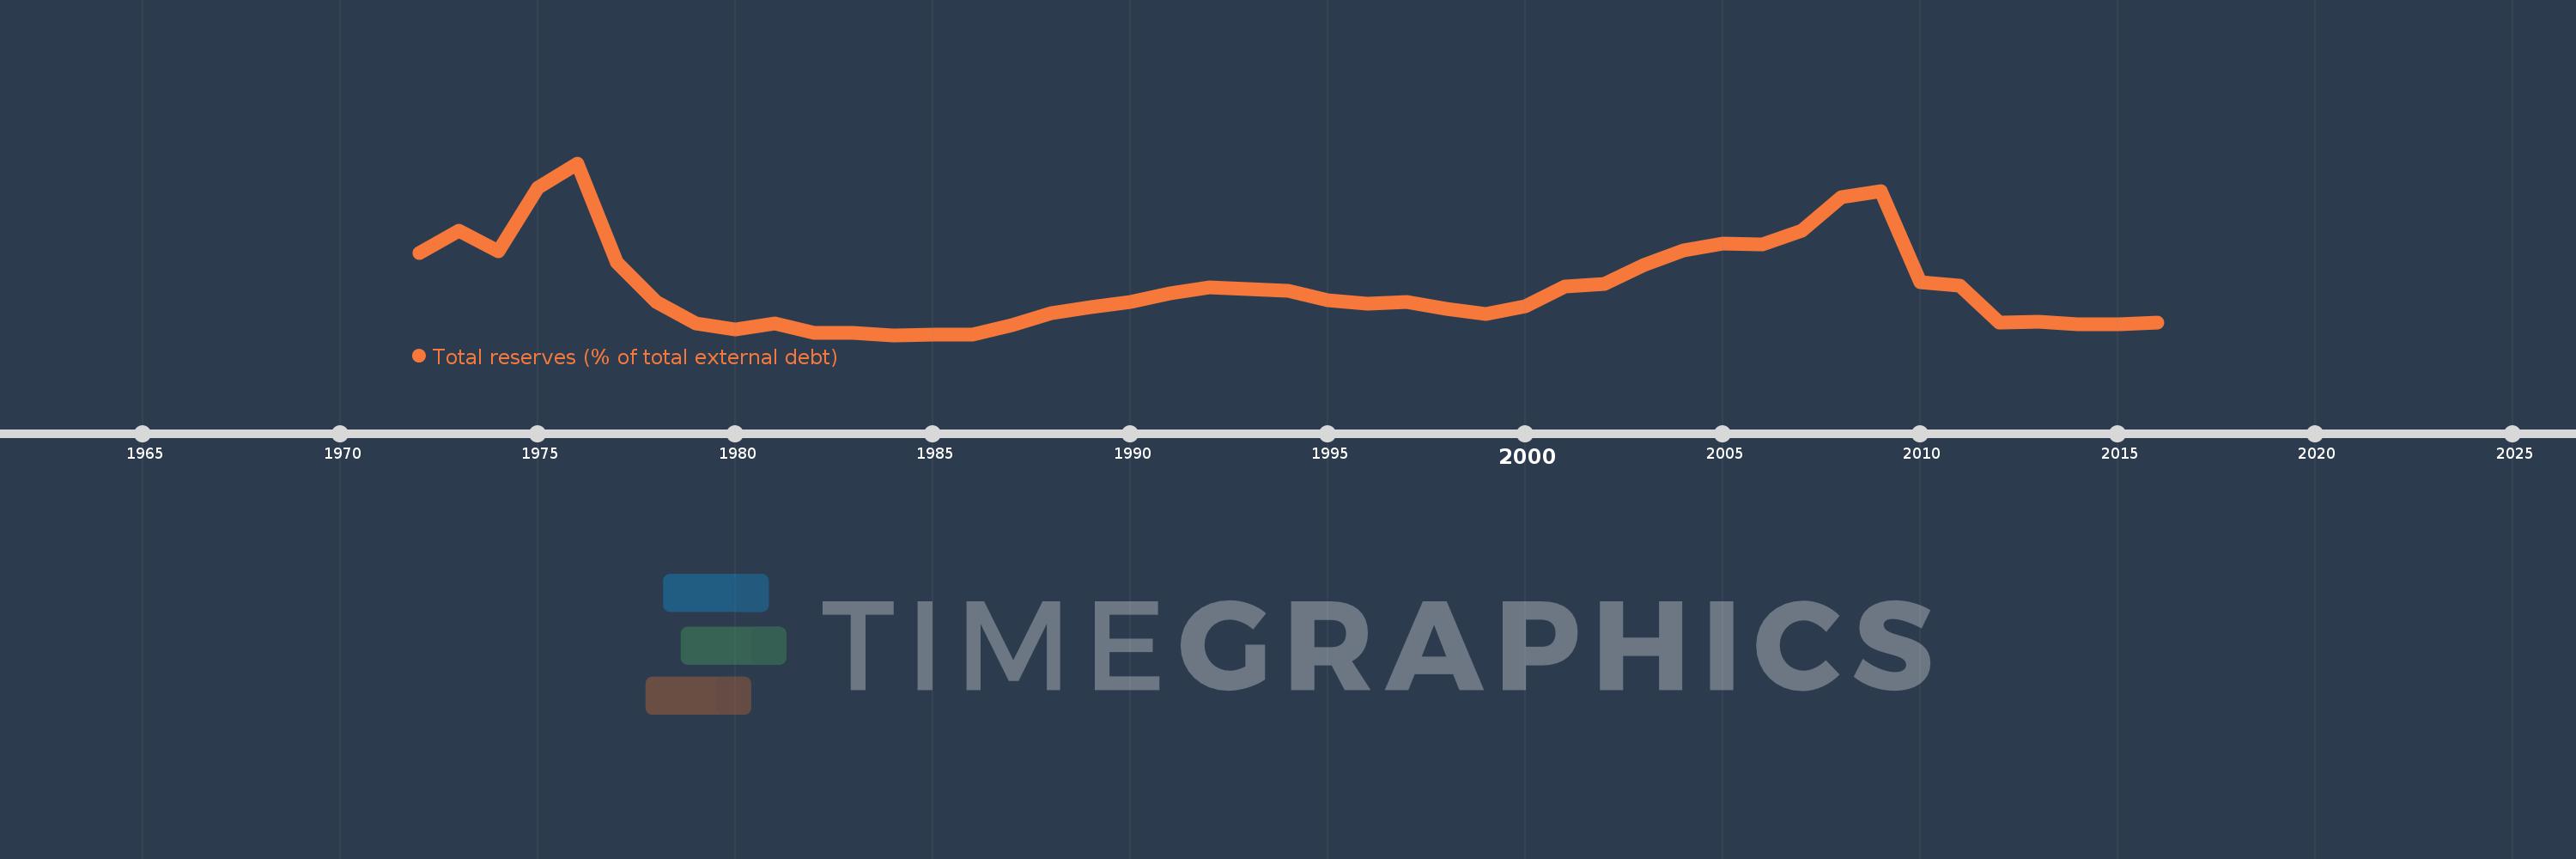
Total reserves (% of total external debt)
2016,2015,2014,2013,2012,2011,2010,2009,2008,2007,2006,2005,2004,2003,2002,2001,2000,1999,1998,1997,1996,1995,1994,1993,1992,1991,1990,1989,1988,1987,1986,1985,1984,1983,1982,1981,1980,1979,1978,1977,1976,1975,1974,1973,1972
This statistics in other country:
Timeline:
This timeline shows a graph from 1972 to 2016 of Mauritius. No data until 1971. Number of actual observations by date: 45.
Source name:
World Development Indicators
Source organization:
World Bank, International Debt Statistics.
Categories, topics:
Financial Sector, External Debt
Last updated:
apr 23, 2017
Indicators value changes by year
Maximum:
318.092
jan 1, 1976
At the date of observation
Value
Absolute change
Change from previous value
jan 1, 1972
155.314
+155.314
0.0%
jan 1, 1973
195.533
+40.22
25.9%
jan 1, 1974
157.795
-37.739
-19.3%
jan 1, 1975
274.132
+116.338
73.73%
jan 1, 1976
318.092
+43.96
16.04%
jan 1, 1977
137.879
-180.213
-56.65%
jan 1, 1978
66.858
-71.021
-51.51%
jan 1, 1979
28.021
-38.837
-58.09%
jan 1, 1980
15.816
-12.205
-43.56%
jan 1, 1981
26.848
+11.032
69.75%
jan 1, 1982
9.907
-16.941
-63.1%
jan 1, 1983
10.024
+0.117
1.18%
jan 1, 1984
6.294
-3.73
-37.21%
jan 1, 1985
6.895
+0.6
9.54%
jan 1, 1986
7.311
+0.417
6.04%
jan 1, 1987
23.765
+16.454
225.06%
jan 1, 1988
46.059
+22.294
93.81%
jan 1, 1989
56.214
+10.154
22.05%
jan 1, 1990
66.72
+10.506
18.69%
jan 1, 1991
81.648
+14.928
22.37%
jan 1, 1992
92.254
+10.606
12.99%
jan 1, 1993
89.068
-3.185
-3.45%
jan 1, 1994
86.679
-2.389
-2.68%
jan 1, 1995
70.201
-16.478
-19.01%
jan 1, 1996
62.695
-7.506
-10.69%
jan 1, 1997
65.687
+2.993
4.77%
jan 1, 1998
53.097
-12.591
-19.17%
jan 1, 1999
45.019
-8.078
-15.21%
jan 1, 2000
57.924
+12.905
28.67%
jan 1, 2001
94.58
+36.656
63.28%
jan 1, 2002
98.313
+3.733
3.95%
jan 1, 2003
134.088
+35.775
36.39%
jan 1, 2004
159.771
+25.683
19.15%
jan 1, 2005
172.144
+12.373
7.74%
jan 1, 2006
170.379
-1.765
-1.03%
jan 1, 2007
195.301
+24.922
14.63%
jan 1, 2008
256.416
+61.115
31.29%
jan 1, 2009
267.769
+11.353
4.43%
jan 1, 2010
102.232
-165.537
-61.82%
jan 1, 2011
95.783
-6.449
-6.31%
jan 1, 2012
29.113
-66.669
-69.6%
jan 1, 2013
30.194
+1.081
3.71%
jan 1, 2014
26.214
-3.981
-13.18%
jan 1, 2015
25.792
-0.422
-1.61%
jan 1, 2016
29.091
+3.3
12.79%
Ranking of countries by current statistics by years


Comments: