29
/
en
AIzaSyAYiBZKx7MnpbEhh9jyipgxe19OcubqV5w
April 1, 2024
86673
Bhutan
BTN
true
2
1
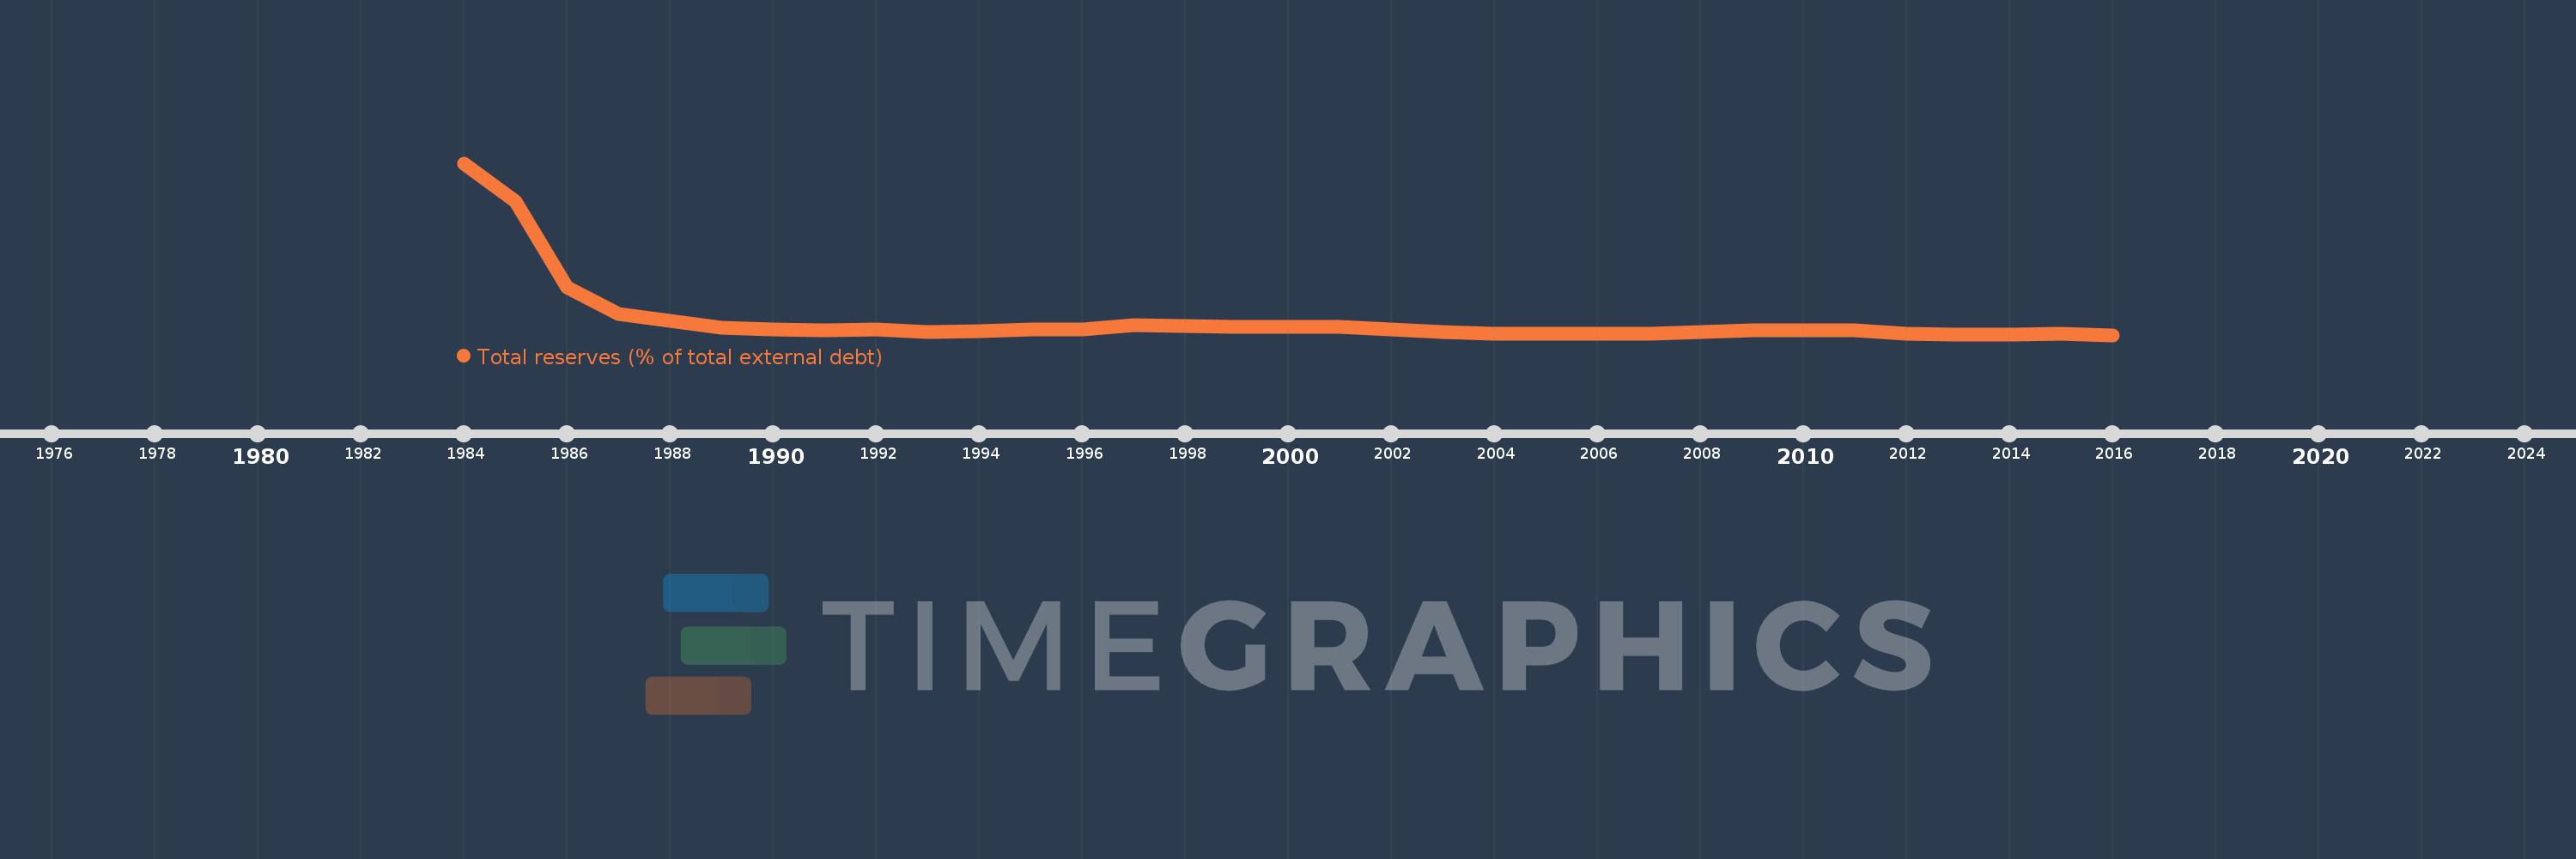
Total reserves (% of total external debt)
2016,2015,2014,2013,2012,2011,2010,2009,2008,2007,2006,2005,2004,2003,2002,2001,2000,1999,1998,1997,1996,1995,1994,1993,1992,1991,1990,1989,1988,1987,1986,1985,1984
This statistics in other country:
Timeline:
This timeline shows a graph from 1984 to 2016 of Bhutan. No data until 1983. Number of actual observations by date: 33.
Source name:
World Development Indicators
Source organization:
World Bank, International Debt Statistics.
Categories, topics:
Financial Sector, External Debt
Last updated:
apr 23, 2017
Indicators value changes by year
Minimum:
56.409
jan 1, 2016
Maximum:
2.011K
jan 1, 1984
At the date of observation
Value
Absolute change
Change from previous value
jan 1, 1984
2.011K
+2.011K
0.0%
jan 1, 1985
1.575K
-436.249
-21.69%
jan 1, 1986
603.747
-971.349
-61.67%
jan 1, 1987
291.15
-312.597
-51.78%
jan 1, 1988
216.066
-75.084
-25.79%
jan 1, 1989
142.628
-73.438
-33.99%
jan 1, 1990
121.896
-20.732
-14.54%
jan 1, 1991
106.332
-15.564
-12.77%
jan 1, 1992
117.327
+10.995
10.34%
jan 1, 1993
95.427
-21.9
-18.67%
jan 1, 1994
101.386
+5.959
6.24%
jan 1, 1995
116.161
+14.775
14.57%
jan 1, 1996
123.341
+7.18
6.18%
jan 1, 1997
168.144
+44.803
36.32%
jan 1, 1998
157.764
-10.38
-6.17%
jan 1, 1999
150.141
-7.622
-4.83%
jan 1, 2000
152.205
+2.064
1.37%
jan 1, 2001
150.128
-2.078
-1.36%
jan 1, 2002
118.572
-31.556
-21.02%
jan 1, 2003
91.944
-26.628
-22.46%
jan 1, 2004
74.266
-17.678
-19.23%
jan 1, 2005
66.291
-7.975
-10.74%
jan 1, 2006
71.189
+4.898
7.39%
jan 1, 2007
75.623
+4.434
6.23%
jan 1, 2008
87.246
+11.624
15.37%
jan 1, 2009
110.349
+23.103
26.48%
jan 1, 2010
113.252
+2.903
2.63%
jan 1, 2011
107.223
-6.029
-5.32%
jan 1, 2012
73.688
-33.535
-31.28%
jan 1, 2013
65.856
-7.832
-10.63%
jan 1, 2014
61.835
-4.021
-6.11%
jan 1, 2015
67.812
+5.977
9.67%
jan 1, 2016
56.409
-11.403
-16.81%
Ranking of countries by current statistics by years


Comments: