29
/
en
AIzaSyAYiBZKx7MnpbEhh9jyipgxe19OcubqV5w
April 1, 2024
136250
Gabon
GAB
true
2
1
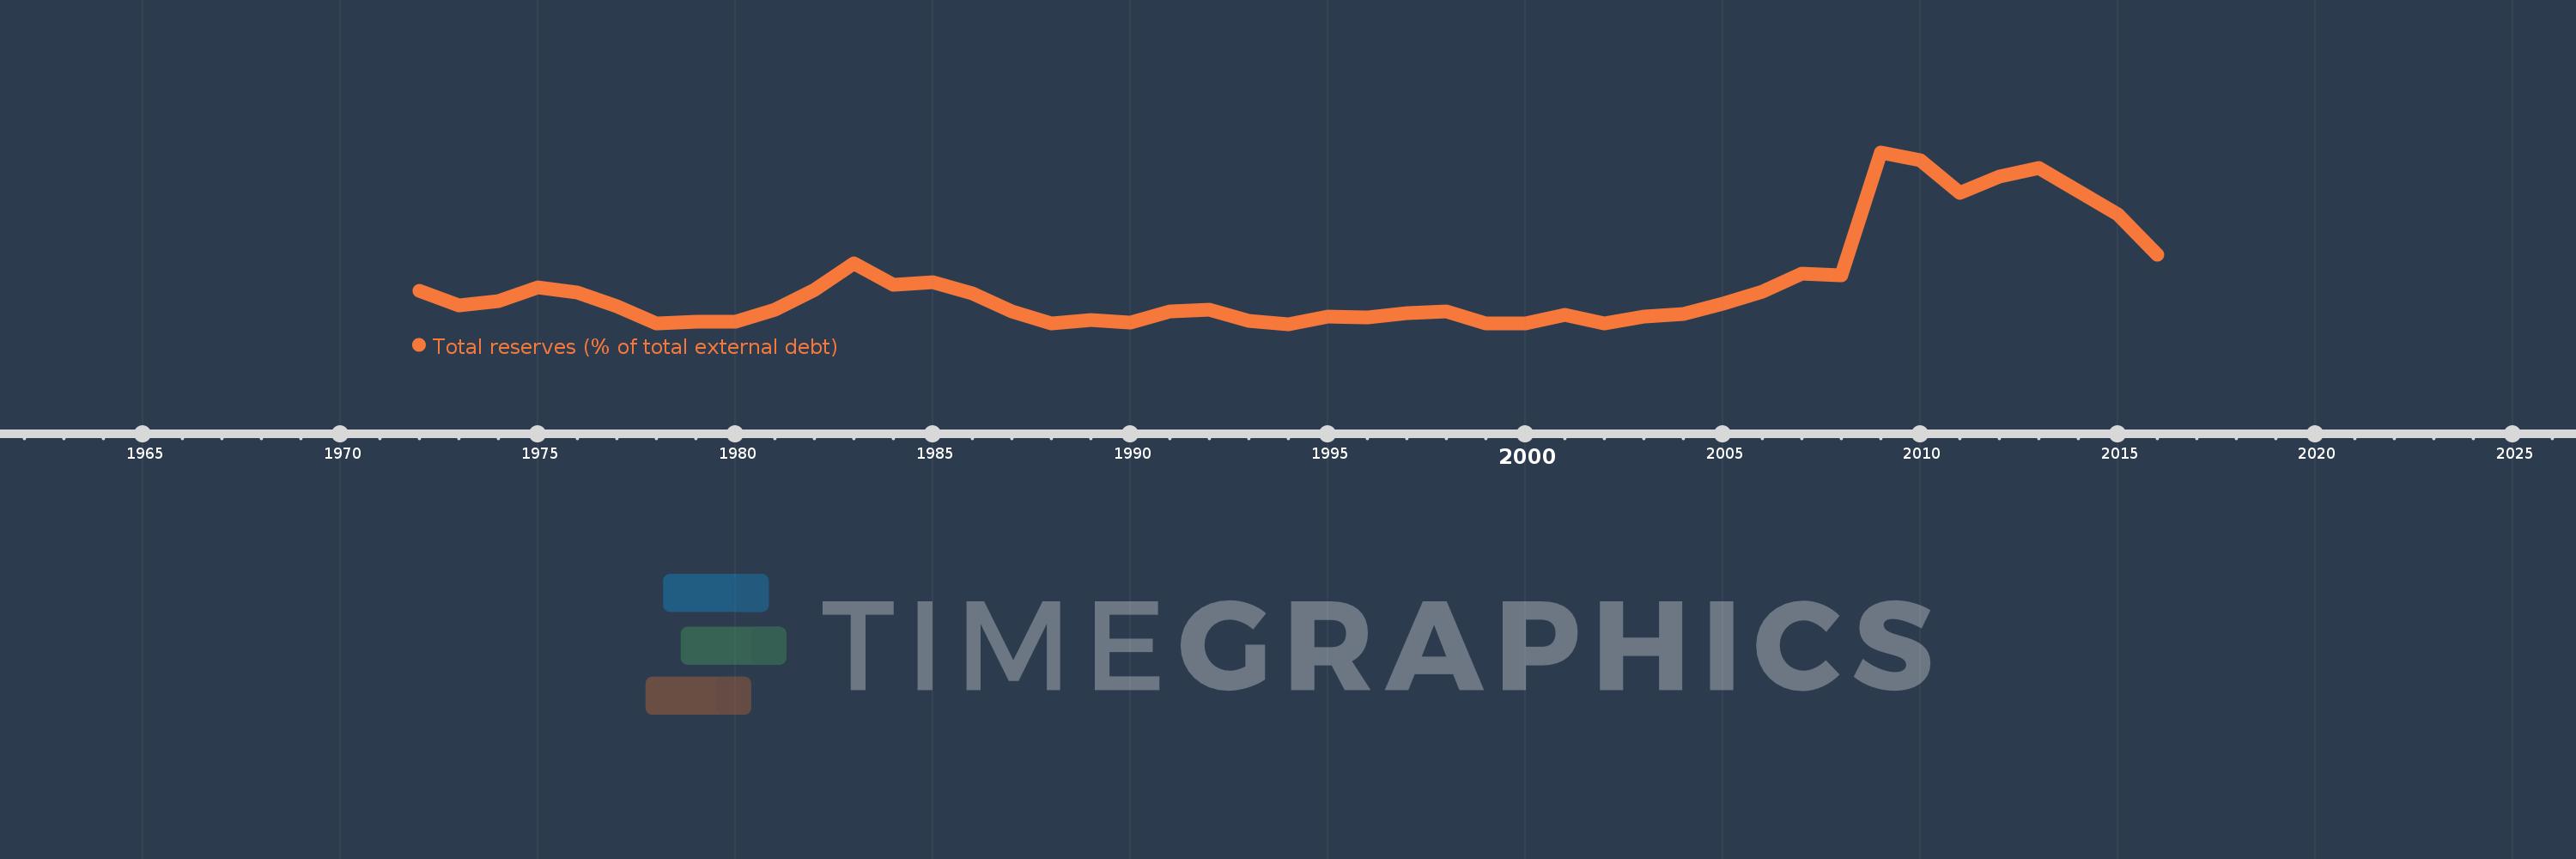
Total reserves (% of total external debt)
2016,2015,2014,2013,2012,2011,2010,2009,2008,2007,2006,2005,2004,2003,2002,2001,2000,1999,1998,1997,1996,1995,1994,1993,1992,1991,1990,1989,1988,1987,1986,1985,1984,1983,1982,1981,1980,1979,1978,1977,1976,1975,1974,1973,1972
This statistics in other country:
Timeline:
This timeline shows a graph from 1972 to 2016 of Gabon. No data until 1971. Number of actual observations by date: 45.
Source name:
World Development Indicators
Source organization:
World Bank, International Debt Statistics.
Categories, topics:
Financial Sector, External Debt
Last updated:
apr 23, 2017
Indicators value changes by year
Maximum:
89.865
jan 1, 2009
At the date of observation
Value
Absolute change
Change from previous value
jan 1, 1972
17.444
+17.444
0.0%
jan 1, 1973
10.115
-7.329
-42.02%
jan 1, 1974
12.078
+1.964
19.41%
jan 1, 1975
19.563
+7.485
61.97%
jan 1, 1976
16.549
-3.014
-15.41%
jan 1, 1977
9.411
-7.138
-43.13%
jan 1, 1978
0.742
-8.668
-92.11%
jan 1, 1979
1.634
+0.892
120.11%
jan 1, 1980
1.543
-0.091
-5.55%
jan 1, 1981
7.591
+6.048
391.85%
jan 1, 1982
17.952
+10.361
136.49%
jan 1, 1983
31.744
+13.792
76.83%
jan 1, 1984
20.954
-10.79
-33.99%
jan 1, 1985
22.115
+1.162
5.54%
jan 1, 1986
16.305
-5.81
-26.27%
jan 1, 1987
6.754
-9.551
-58.58%
jan 1, 1988
0.691
-6.063
-89.77%
jan 1, 1989
2.552
+1.861
269.29%
jan 1, 1990
1.178
-1.374
-53.83%
jan 1, 1991
6.998
+5.819
493.88%
jan 1, 1992
7.862
+0.865
12.35%
jan 1, 1993
1.961
-5.901
-75.06%
jan 1, 1994
0.149
-1.811
-92.39%
jan 1, 1995
4.317
+4.168
2.79K%
jan 1, 1996
3.51
-0.808
-18.71%
jan 1, 1997
5.879
+2.369
67.5%
jan 1, 1998
6.69
+0.811
13.79%
jan 1, 1999
0.431
-6.258
-93.55%
jan 1, 2000
0.541
+0.11
25.48%
jan 1, 2001
4.939
+4.398
812.48%
jan 1, 2002
0.39
-4.549
-92.11%
jan 1, 2003
4.125
+3.735
957.95%
jan 1, 2004
5.355
+1.23
29.82%
jan 1, 2005
10.997
+5.642
105.35%
jan 1, 2006
17.325
+6.328
57.54%
jan 1, 2007
26.683
+9.358
54.01%
jan 1, 2008
25.473
-1.21
-4.54%
jan 1, 2009
89.865
+64.392
252.78%
jan 1, 2010
85.751
-4.115
-4.58%
jan 1, 2011
68.779
-16.972
-19.79%
jan 1, 2012
77.091
+8.313
12.09%
jan 1, 2013
81.946
+4.854
6.3%
jan 1, 2014
69.476
-12.47
-15.22%
jan 1, 2015
57.593
-11.882
-17.1%
jan 1, 2016
36.551
-21.042
-36.54%
Ranking of countries by current statistics by years


Comments: