29
/
en
AIzaSyAYiBZKx7MnpbEhh9jyipgxe19OcubqV5w
April 1, 2024
236577
Senegal
SEN
true
2
1
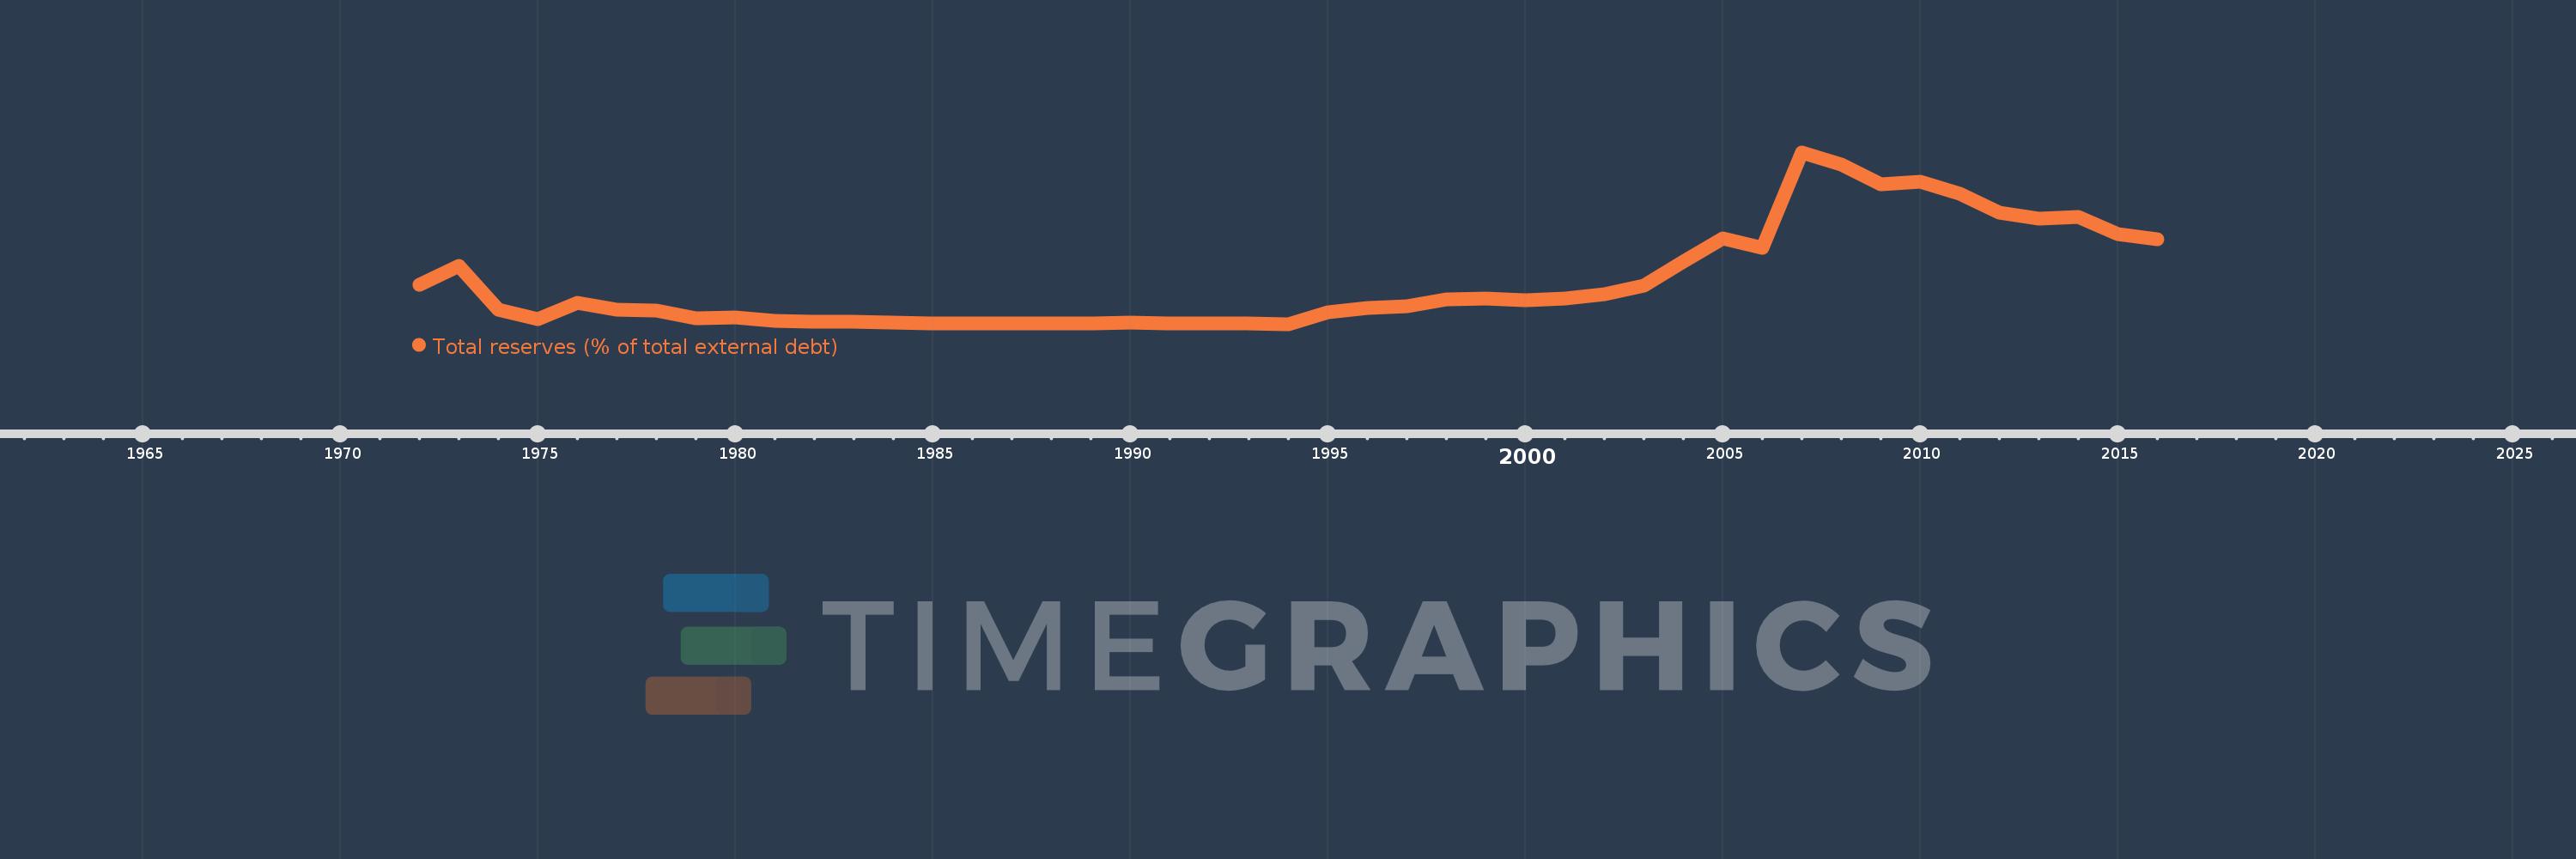
Total reserves (% of total external debt)
2016,2015,2014,2013,2012,2011,2010,2009,2008,2007,2006,2005,2004,2003,2002,2001,2000,1999,1998,1997,1996,1995,1994,1993,1992,1991,1990,1989,1988,1987,1986,1985,1984,1983,1982,1981,1980,1979,1978,1977,1976,1975,1974,1973,1972
This statistics in other country:
Timeline:
This timeline shows a graph from 1972 to 2016 of Senegal. No data until 1971. Number of actual observations by date: 45.
Source name:
World Development Indicators
Source organization:
World Bank, International Debt Statistics.
Categories, topics:
Financial Sector, External Debt
Last updated:
apr 23, 2017
Indicators value changes by year
Maximum:
68.899
jan 1, 2007
At the date of observation
Value
Absolute change
Change from previous value
jan 1, 1972
16.153
+16.153
0.0%
jan 1, 1973
23.815
+7.663
47.44%
jan 1, 1974
6.049
-17.766
-74.6%
jan 1, 1975
2.384
-3.665
-60.58%
jan 1, 1976
8.916
+6.532
273.95%
jan 1, 1977
6.156
-2.761
-30.96%
jan 1, 1978
5.743
-0.412
-6.7%
jan 1, 1979
2.656
-3.088
-53.76%
jan 1, 1980
3.028
+0.373
14.04%
jan 1, 1981
1.708
-1.32
-43.6%
jan 1, 1982
1.209
-0.5
-29.25%
jan 1, 1983
1.327
+0.118
9.76%
jan 1, 1984
1.123
-0.204
-15.38%
jan 1, 1985
0.575
-0.548
-48.8%
jan 1, 1986
0.568
-0.007
-1.2%
jan 1, 1987
0.641
+0.073
12.91%
jan 1, 1988
0.576
-0.065
-10.2%
jan 1, 1989
0.574
-0.001
-0.24%
jan 1, 1990
0.935
+0.36
62.71%
jan 1, 1991
0.59
-0.345
-36.88%
jan 1, 1992
0.654
+0.064
10.85%
jan 1, 1993
0.598
-0.056
-8.53%
jan 1, 1994
0.384
-0.215
-35.87%
jan 1, 1995
5.158
+4.774
1.24K%
jan 1, 1996
6.941
+1.783
34.56%
jan 1, 1997
7.615
+0.674
9.71%
jan 1, 1998
10.148
+2.533
33.27%
jan 1, 1999
10.516
+0.368
3.62%
jan 1, 2000
10.073
-0.443
-4.21%
jan 1, 2001
10.608
+0.535
5.31%
jan 1, 2002
12.318
+1.71
16.12%
jan 1, 2003
15.645
+3.327
27.01%
jan 1, 2004
25.26
+9.615
61.46%
jan 1, 2005
34.709
+9.449
37.41%
jan 1, 2006
30.712
-3.997
-11.51%
jan 1, 2007
68.899
+38.187
124.34%
jan 1, 2008
64.199
-4.7
-6.82%
jan 1, 2009
56.199
-8.0
-12.46%
jan 1, 2010
57.062
+0.863
1.54%
jan 1, 2011
52.372
-4.69
-8.22%
jan 1, 2012
44.981
-7.391
-14.11%
jan 1, 2013
42.433
-2.548
-5.67%
jan 1, 2014
43.117
+0.684
1.61%
jan 1, 2015
36.268
-6.849
-15.89%
jan 1, 2016
34.138
-2.13
-5.87%
Ranking of countries by current statistics by years


Comments: